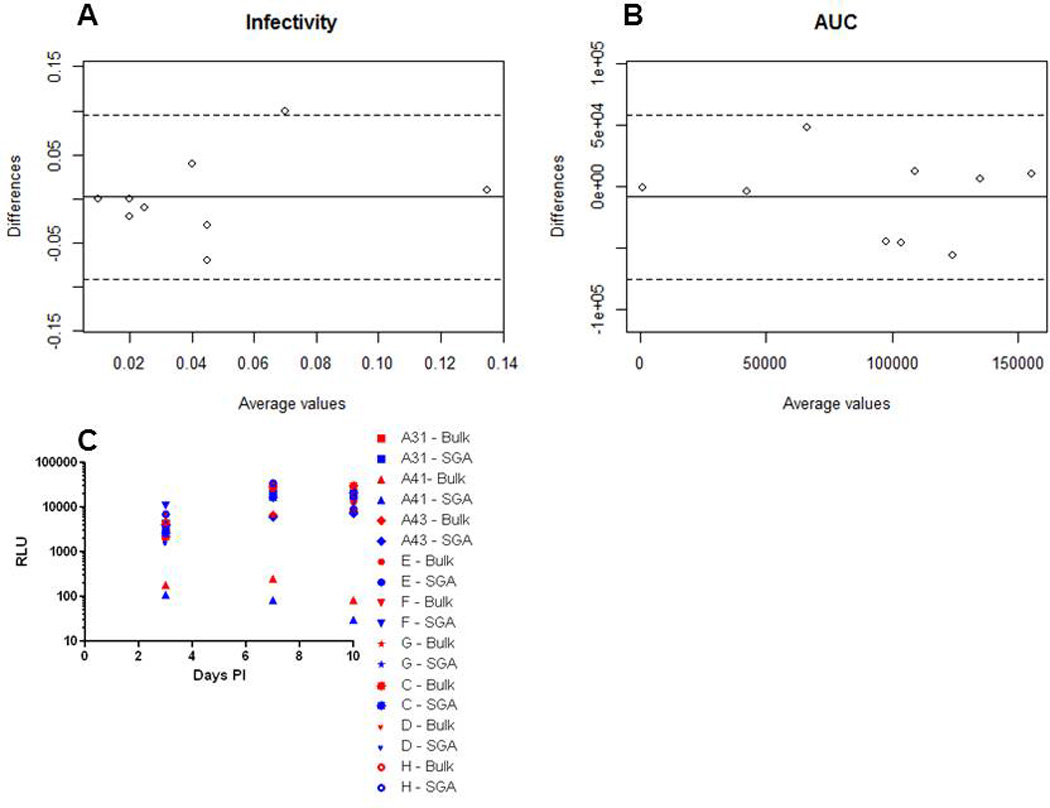
Figure 3. Virus stocks with either SGA or bulk PCR derived envelopes have similar infectivity and replication kinetics.

Bland Altman plots of infectivity (A) and replication kinetics (B) among virus stocks with pool of either SGA or bulk PCR envelopes. The solid line shows the mean difference among the 2 methodologies and the dotted lines delineate values at 2 standard deviations of the difference. Graph C shows the relative light units (RLU) per ul (y-axis) generated from infecting TZM-bl cells with virus stocks collected at different days post – infection (x-axis). Replication kinetics was quantified by measuring the area under the curve (AUC) for a plot of RLU per ul of virus stock versus days post-infection on TZM-bl cells at days 3, 7 and 10 post-infection of CD4+ T cells. The mean difference in infectivity and AUC was 0.0022 and −8,399 respectively. The standard deviation in infectivity and AUC was 0.047 and 34,044 respectively. The x-axis shows the average and the y-axis shows the difference of the value obtained by the 2 methodologies.
