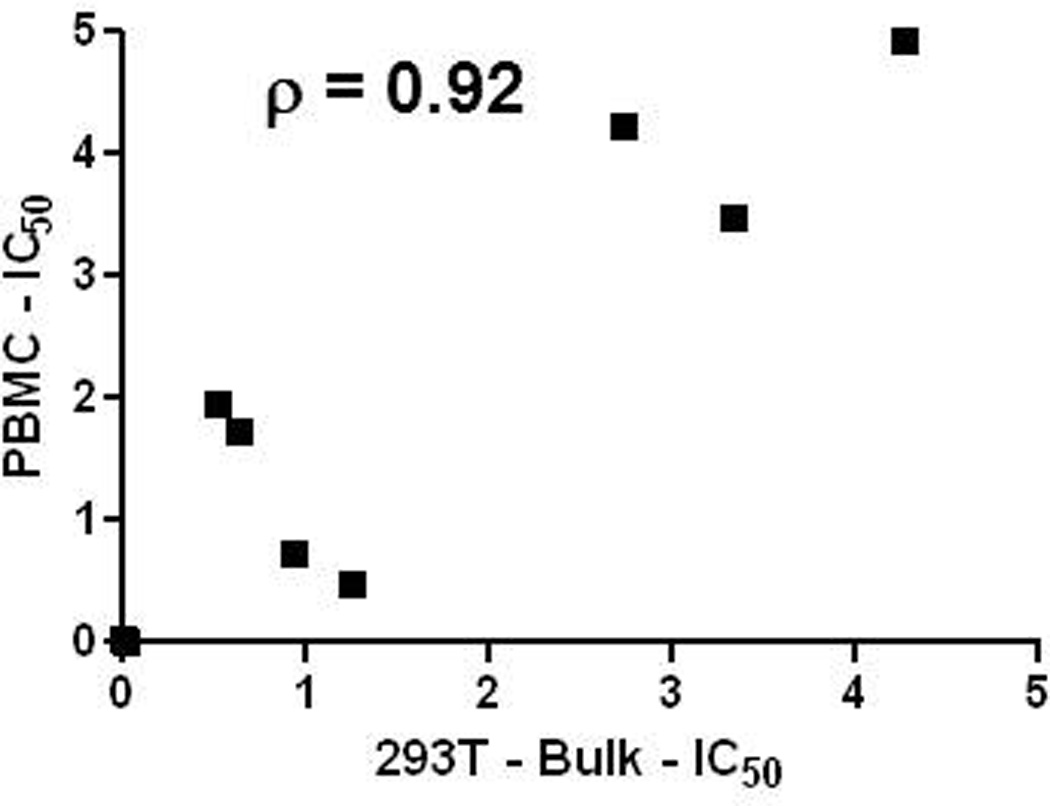
Figure 5. The IC50s for 293T derived and PBMC passage virus stocks are correlated.

Graph shows IC50s for 293T virus stocks with bulk envelope PCRs (x – axis) compared to short term PBMC passage virus (y-axis). All virus antibody combinations that yielded an IC50 above the maximum tested antibody concentration were not included in this analysis. Graph also shows the estimated correlation coefficient for a best fit linear regression curve.
