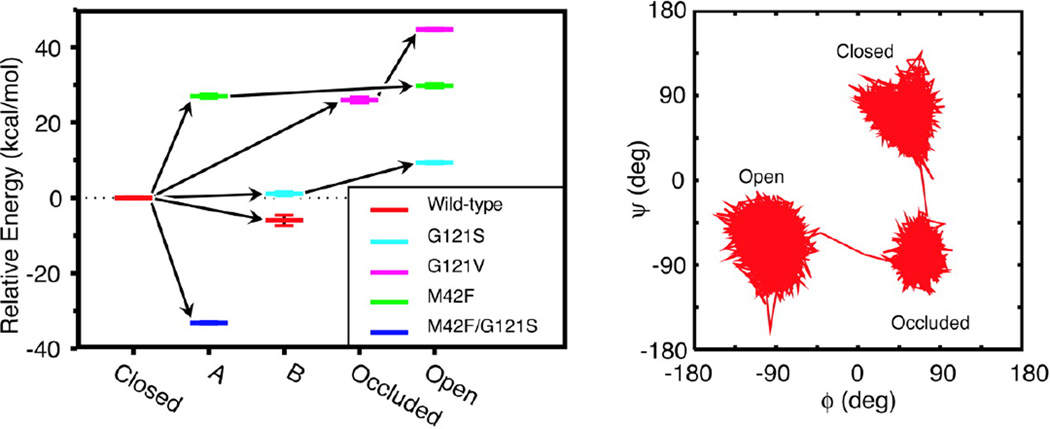
Fig. 4.
(Left) Shown are the energy levels for different conformations of the Met20 loop sampled in the simulations of native and mutant Michaelis complexes of DHFR, relative to the closed conformation. Each color represents a particular mutant, and the five different conformations found from our cluster analysis are shown along the horizontal axis. The energies are the average energies calculated by using a generalized Born implicit solvent model from snapshots from the portions of the trajectories belonging to particular loop conformations. The error bars represent the standard errors about these averages. The arrows indicate the progression in time. (Right) Shown is a representative trajectory in ϕ−ψ space for loop residue Gly-17 in the G121V mutant to illustrate the extent to which different conformations may be differentiated. (Figure 4 of Rod TH, Radkiewicz JL, Brooks III CL (2003) Proc. Nat. Acad. Sci. USA 100: 6980, Copyright © 2003, National Academy of Sciences USA)

