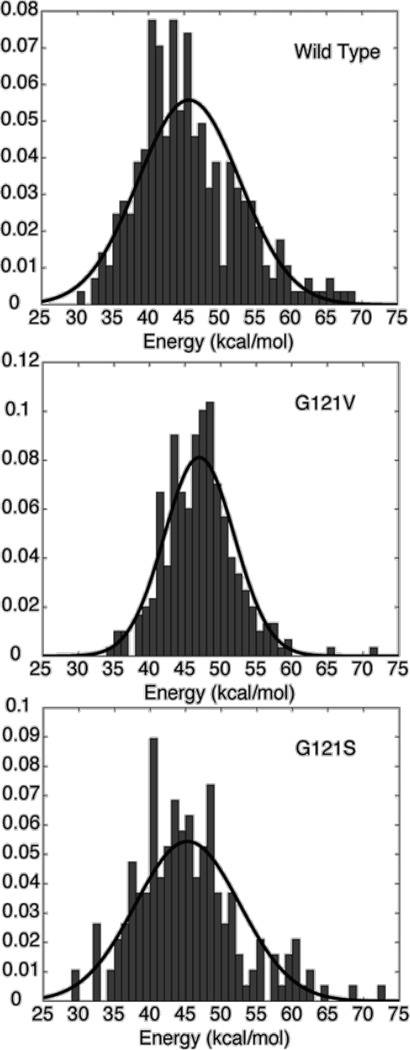
Fig. 5.
Histograms of calculated hydride transfer energy barrier distributions for (a) wild type, (b) G121V, and (c) G121S enzymes. The lines represent a Gaussian fit to the data. (Figure 2 of Thorpe IF, Brooks III CL (2003) J. Phys. Chem. B 107: 14042, Copyright 2003, © The American Chemical Society)

