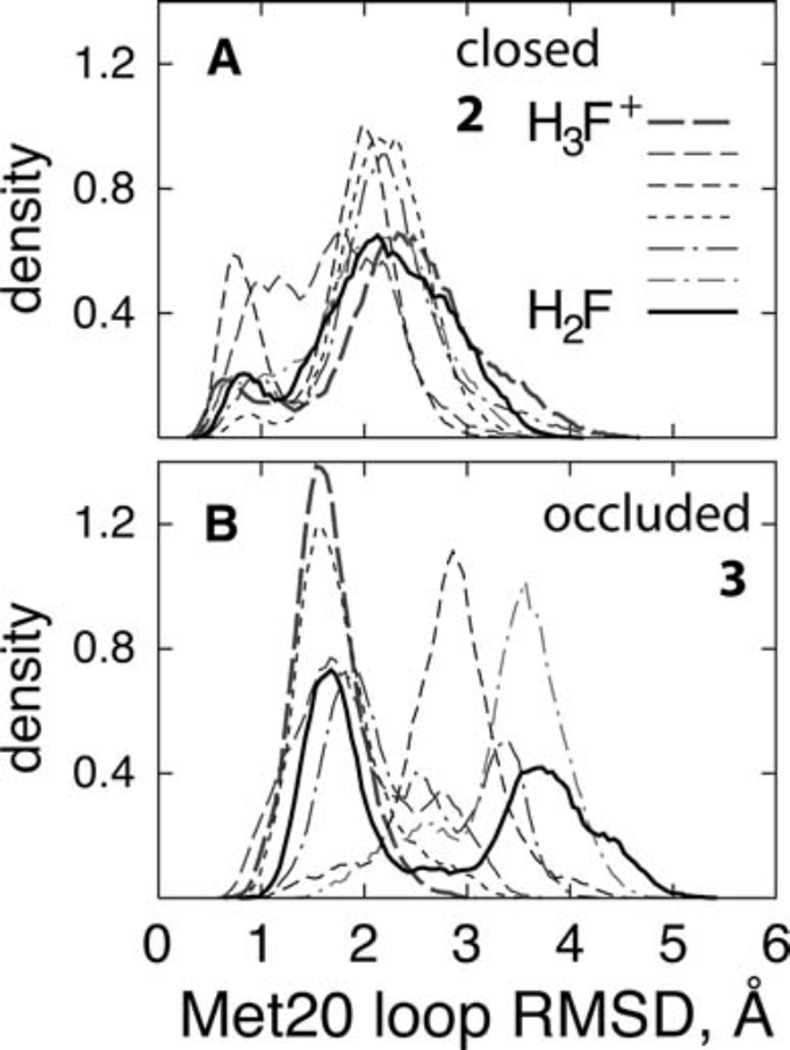
Fig. 7.
The distributions of the Met20 loop RMSD in (Å) the closed complex and (B) the occluded complex. All FEP windows are shown (thin lines), along with the endpoint states (thick lines) to illustrate the overlap between the windows. (Figure 5 of Khavrutskii IV, Price DJ, Lee J, Brooks III CL (2007) Protein Sci. 16: 1087, Copyright © 2007, The Protein Society)

