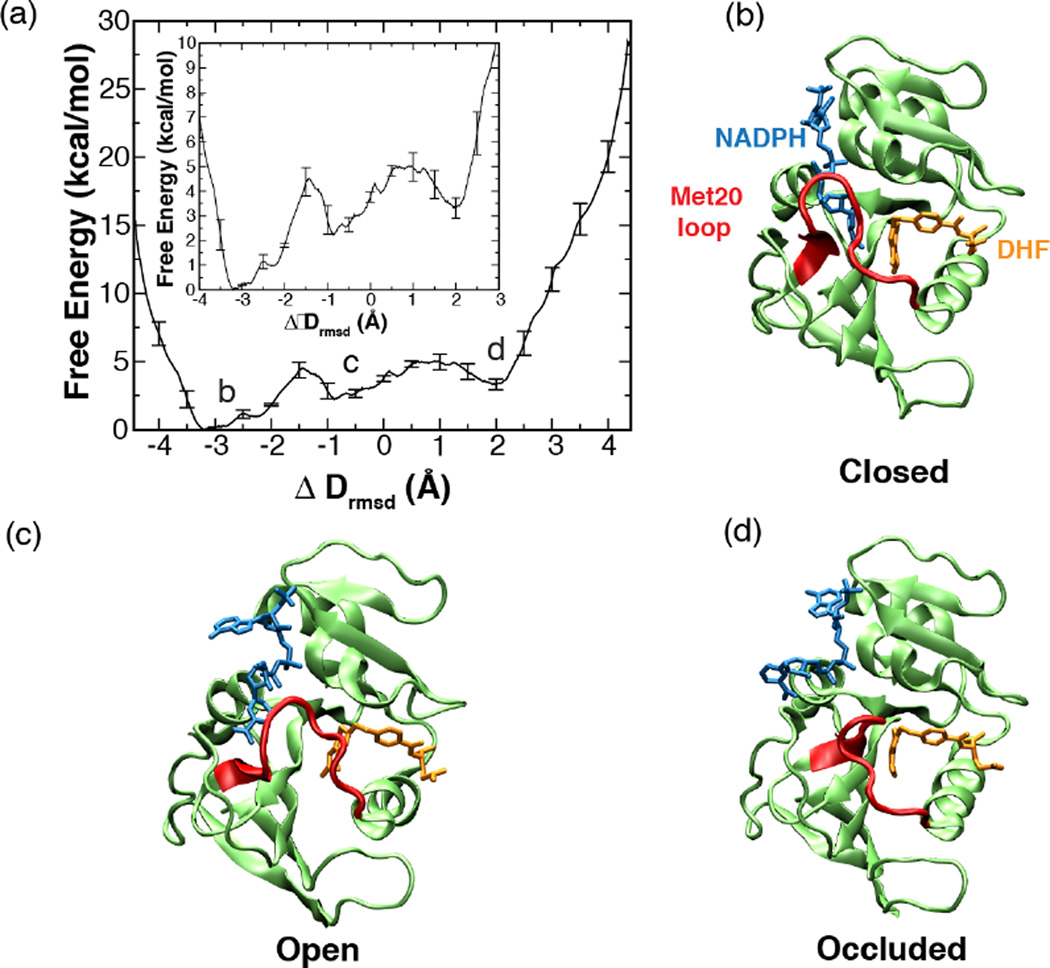
Fig. 9.
One-dimensional free energy profile along the ΔDrmsd order parameter. The error bars represent the standard deviation in the energy values determined from the set of three umbrella sampling MD simulations with different initial velocities. Inset depicts the enlarged view of the same plot. (a, c, and d) Representative structures, closed, open and occluded (top right to bottom right) corresponding to the three free energy minima (a, top left) along DHFR’s conformational change pathway. (Fig. 2 of Arora K and Brooks, C. L. (2009), J. Amer. Chem. Soc. 131:5642, Copyright © 2007, The American Chemical Society)

