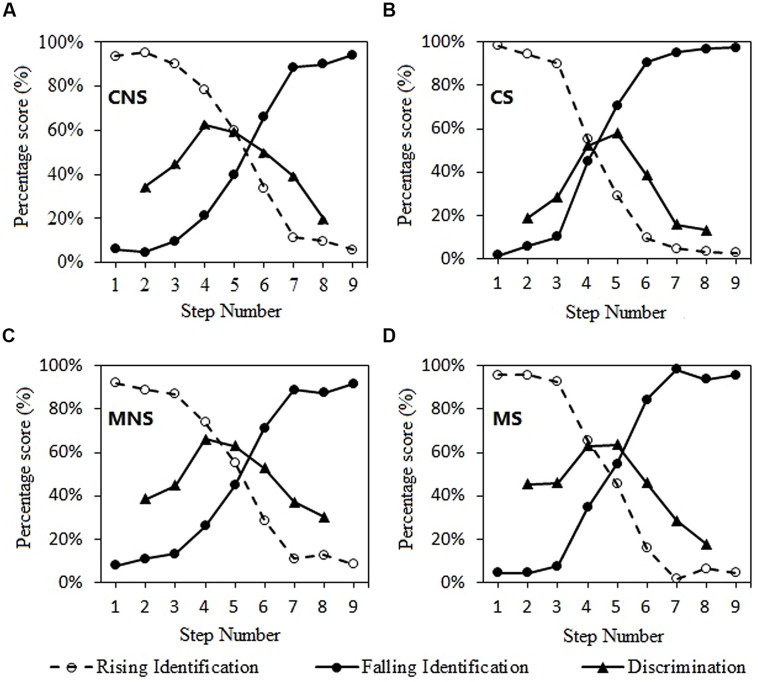
FIGURE 2.
Logistic identification functions and two-step discrimination curves. The “level” logistic response functions were plotted by reflecting the “falling” logistic response functions (Plevel = 1-Pfalling). The discrimination curves were obtained from proportion of “different responses.” (A) non-musician, non-speech; (B) non-musician, speech; (C) musician, non-speech; (D) musician, speech.

