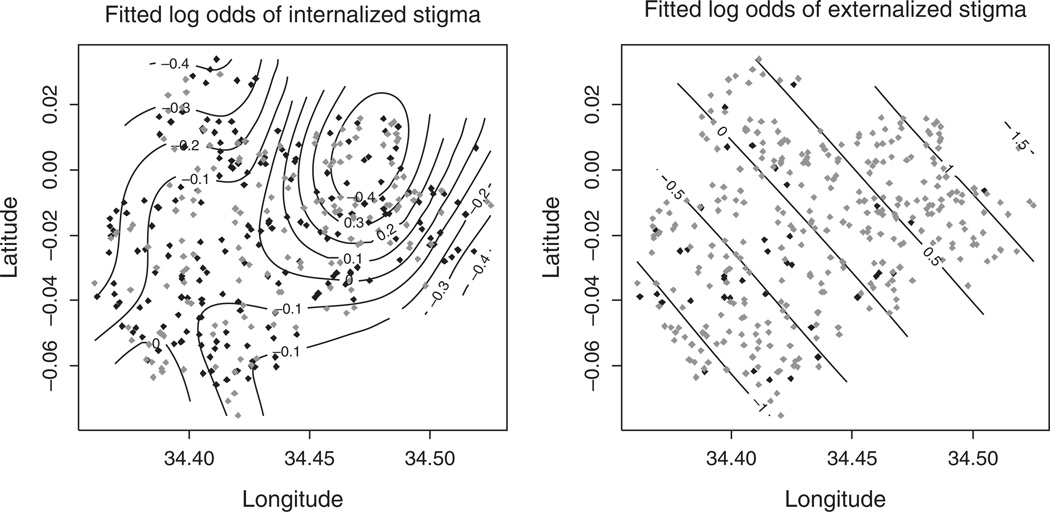
Fig. 2. Fitted log odds surface from the generalized additive model of reporting any stigma (grey points) relative to reporting no stigma (black points) for internalized (left) and externalized (right) stigma, both adjusted for age, education, occupation, marital status, self-reported HIV status, knowing someone with HIV, number of televisions, number of cellular phones, and number of radios.
In contrast to the internalized indicator which is flat (P=0.70), there is a significant deviation from a flat surface for externalized stigma (P=0.01), with a gradient indicating lower rates of externalized stigma than expected in the southwest portion of the study area.

