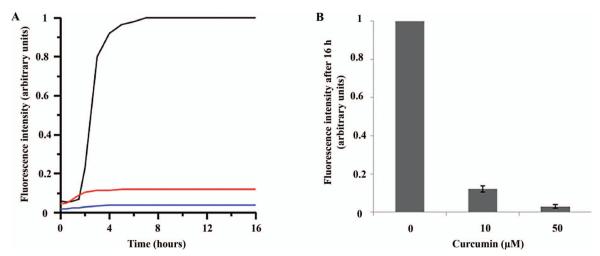
Figure 2.
Thioflavin T assay for h-IAPP in the presence and absence of curcumin. h-IAPP was incubated with curcumin at 0 μM (black line), 10 μM (red line) and 50 μM (blue line) during fibril formation. A: Representative spectra for the given curcumin concentrations. B: Fluorescence intensity quantification (n = 6). Six separate measurements yielded a highly reproducible curcumin dependent loss in signal intensity. This is evidenced by the standard deviation for the final plateau values after 16 h, which were 0.02 and 0.01 (arbitrary units; equivalent to 2 and 1% of the control amplitude without curcumin) for 10 and 50 μM curcumin, respectively.

