
Figure 4.
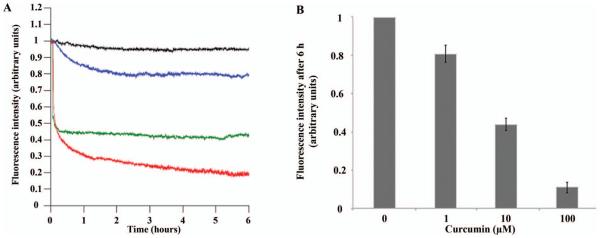
Thioflavin assay for h-IAPP preformed fibrils in the presence and absence of curcumin. h-IAPP fibrils were incubated with curcumin at 1 μM (blue line), 10 μM (green line) and 100 μM (red line) and compared to control (black line). Time = 0 indicates the point at which curcumin was added to the sample. A: Representative spectra for the given curcumin concentrations. B: Fluorescence intensity quantification (n = 6). All experiments reproducibly showed a dose-dependent loss of ThT fluorescence. The standard deviation for the final plateau values after × h were 0.05, 0.03 and 0.03 (arbitrary units equivalent to 5 and 3% of the starting signal) for 1, 10 and 100 μM curcumin, respectively.