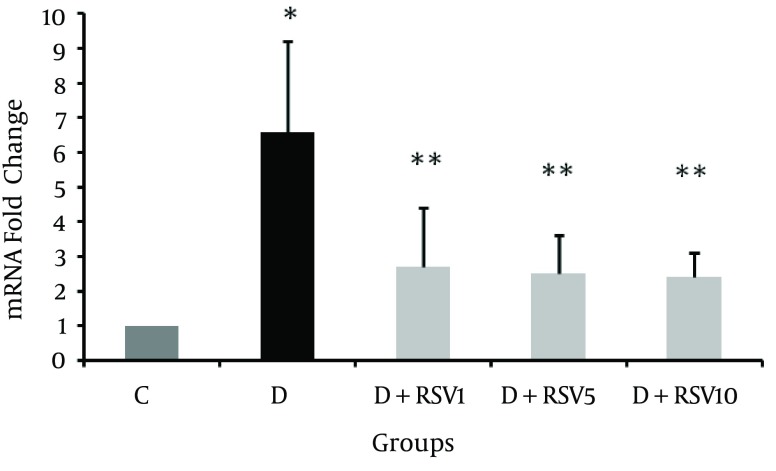
Figure 4. mRNA Folding Changes of RAGE in Renal Tissue of Diabetic and Resveratrol Treated Diabetic Rats.
The data represent mean ± SD of 8 rats. *p < 0.001 versus control; **p < 0.05 versus diabetic group. C: control normal, D: diabetic, D + RSV1: diabetic treated with RSV (1 mg/kg body weight), D + RSV5: diabetic treated with RSV (5 mg/kg body weight), D + RSV10: diabetic treated with RSV (10 mg/kg body weight).

