
Figure 3.
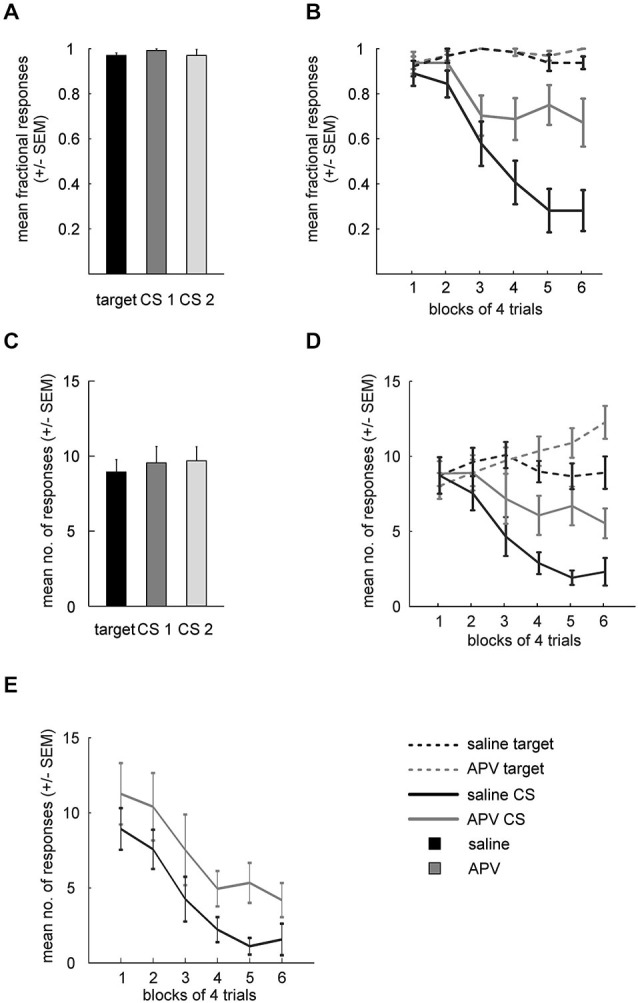
Results from APV injections. (A) Mean fractional response counts (±SEM) for the target and the two CS in the last three acquisition sessions. (B) Mean fractional response counts (±SEM) during extinction learning. Dashed and solid lines depicted data from target and CS trials, respectively. Gray lines, extinction under APV, black lines, extinction under saline. (C) Mean absolute response rate (±SEM) during the last 3 days of acquisition. (D) Absolute response counts mirror results from fractional response counts and additionally indicate unspecific disinhibition of conditioned responding. (E) Normalized response counts reveal prolonged extinction for APV treated subjects.