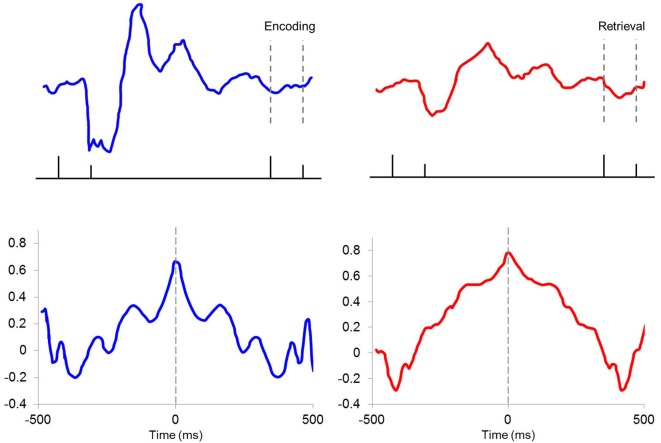
Figure 9.
Encoding and retrieval phases for T+ and T− LFPs. Average LFPs for T+ (top left) and T− (top right) animals showing (ticks from left to right) tone onset, tone offset, airpuff onset, and airpuff offset. Differences in theta rhythm reset results in T+ animals receiving the US during a theta peak, while T− animals receive the US during a theta trough, corresponding to encoding and retrieval phases of the Hasselmo model, respectively. Autocorrelations of multi-unit responding during the trace period show rhythmicity in T+ units (bottom left) that is not seen in T− units (bottom right).

