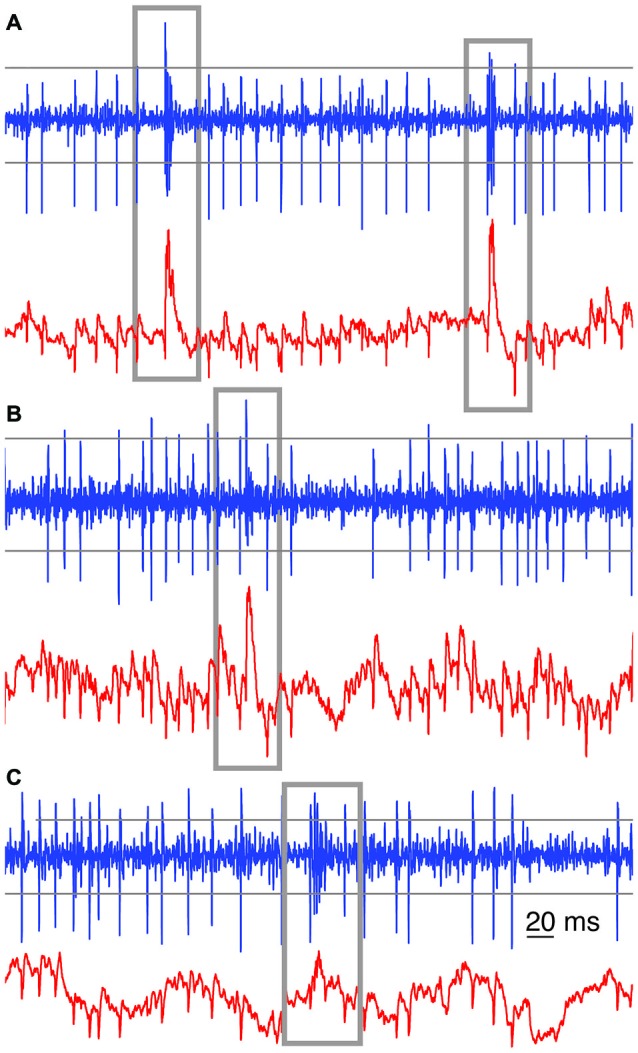
Figure 1.

Examples of automated complex spikes (CS) recognition. Gray boxes were drawn around each recognized CS among the SSs, in high band-pass filtered (blue trace) and low-pass filtered signals (red trace) from three raw extracellular voltage recordings. In (A) the imprints of the CSs on the low (red) and band pass filtered (blue) traces are clearly visible and either of them is sufficient to detect CSs reliably. In (B) the imprint of the CS on the low-pass filtered trace (red) provides a better means for CS recognition. In (C) a combined approach was used. Closely following threshold recognition in the band-pass filtered signal would give a fairly good CS recognition. Parameters were set to prevent false-negatives. Across the panels, the horizontal gray lines depict sample thresholds for CS detection in the band-pass filtered (300–3000 Hz) signals. For the low-pass (<250 Hz) filtered signal, a sliding window threshold was used instead (not shown).
