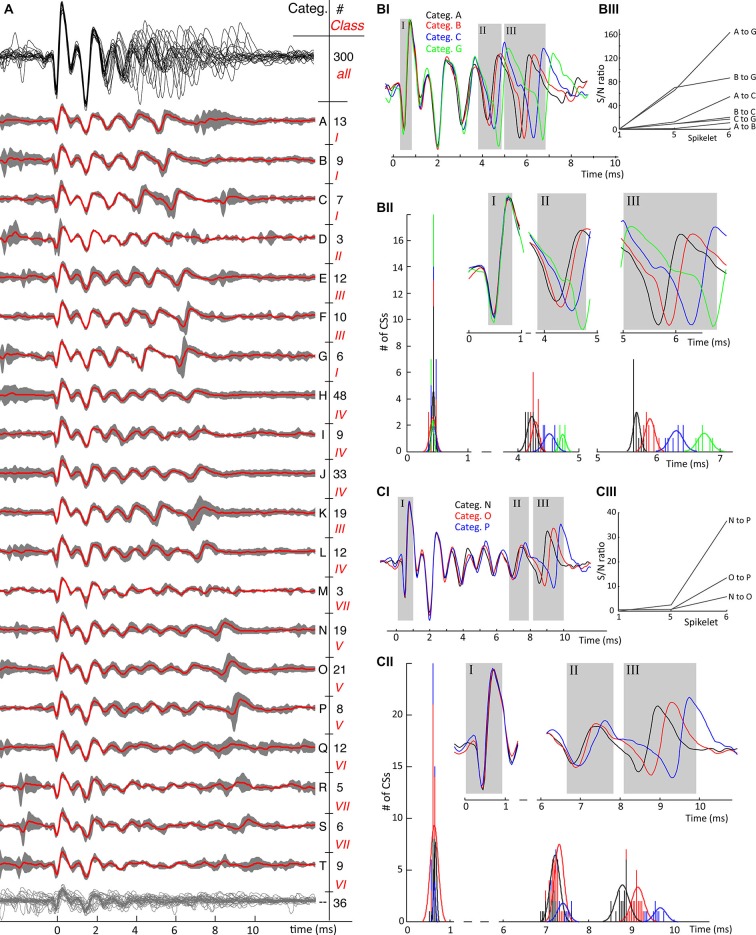
Figure 5.
Second example of mean category waveforms and their variability. (A) An overview of identified waveform categories from cell 7, same conventions as in Figure 4A. The waveforms of all categories show a uniform initial phase as shown by the upper waveform overlay in black where after the number of spikelets, their timing and their amplitudes differ. The CSs in this cell show 7 classes, ranging from 6 clear spikelets, class I, till 10 spikelets in class VII, which are harder to distinguish although not impossible. Categories Q, R, S and T have low amplitude late spikelets and therefore have less characteristic features. In this recording 36 CSs out of 300 could not be categorized, grouped together at the bottom having no category letter. (BI) Timing of last spikelet(s) shows jitter between CS categories. A similar convention as in Figures 4CI–III is used: The full-length mean waveforms compared are shown in the (B/C–I) block. Spikelets further analyzed are shown in the gray rectangles in the (B/C–II) blocks corresponding with the ones in the mean waveform panels. The time histograms in each comparison show the time distributions of the analyzedare spikelets. The signal-to-noise ratios between the spikelet time populations shown in the (B/C–III) blocks. The S/N ratios in both comparisons demonstrate the spread of spikelet timing towards the end of the CSs. B. Comparison of categories with 6 spikelets. The timings of both the second-to-last (categories A and B vs. C and G) and last spikelet (all categories) do not overlap. C. Comparison of categories with 9 spikelets. For these categories only the last spikelet is well separated. (Categ. = category).

