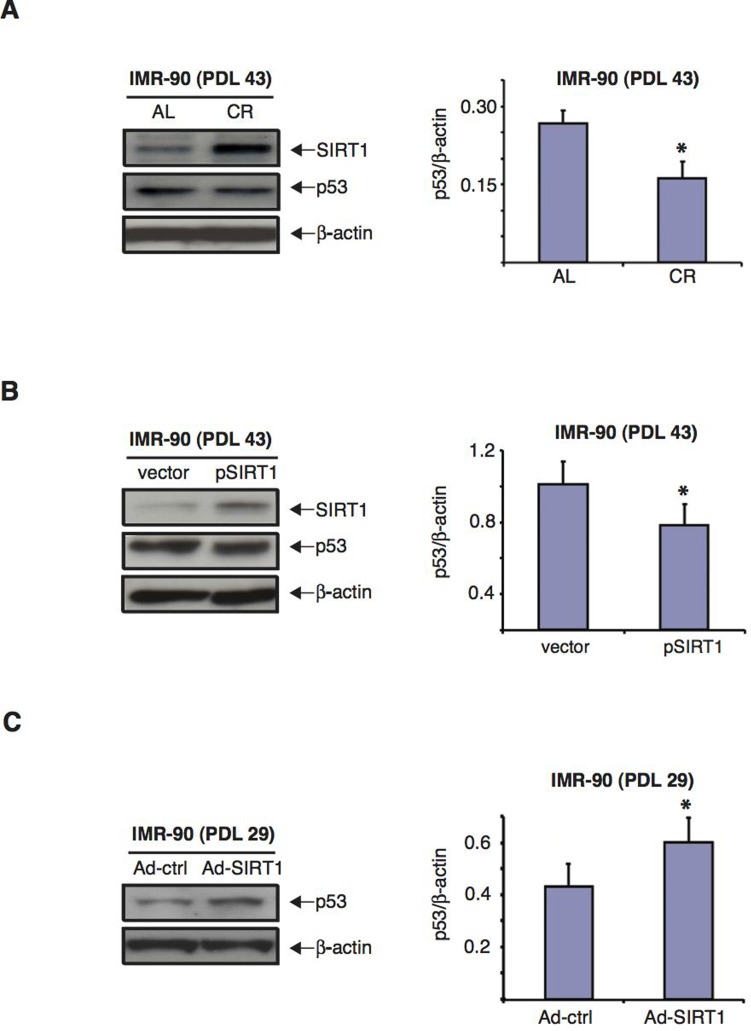
Figure 7. CR serum and over-expression of SIRT1 decrease p53 levels whereas SIRT1 knockdown increases them in IMR-90 cells.
(A) Representative immunoblots for SIRT1 (upper panel), p53 (middle panel) and β-actin (lower panel) proteins of cell extracts from IMR-90 cells (PDL 43) cultured for 72 hours in media with CR (second lane) or AL (first lane) rat serum. Right panel shows the quantification of p53 levels for immunoblots shown on the left after correction for actin controls (* = p< 0.05 CR vs. AL). (B) Representative immunoblots for SIRT1 (upper panel), p53 (middle panel) and β-actin (lower panel) proteins of extracts from IMR-90 cells (PDL 43) transfected twenty four hours prior to lysis with either pSIRT1 or empty vector. Right panel shows the quantification of p53 levels for the immunoblots shown on the left after correction for actin controls (* = p<0.05, pSIRT1 vs. vector). (C) Representative immunoblots for p53 (upper panel) and β-actin (lower panel) of proteins extracts from IMR-90 cells (PDL 29) forty-eight hours after infection with either Ad-SIRT1 or Ad-ctrl (negative control). Data shown in A, B and C are representative of three independent experiments per group.

