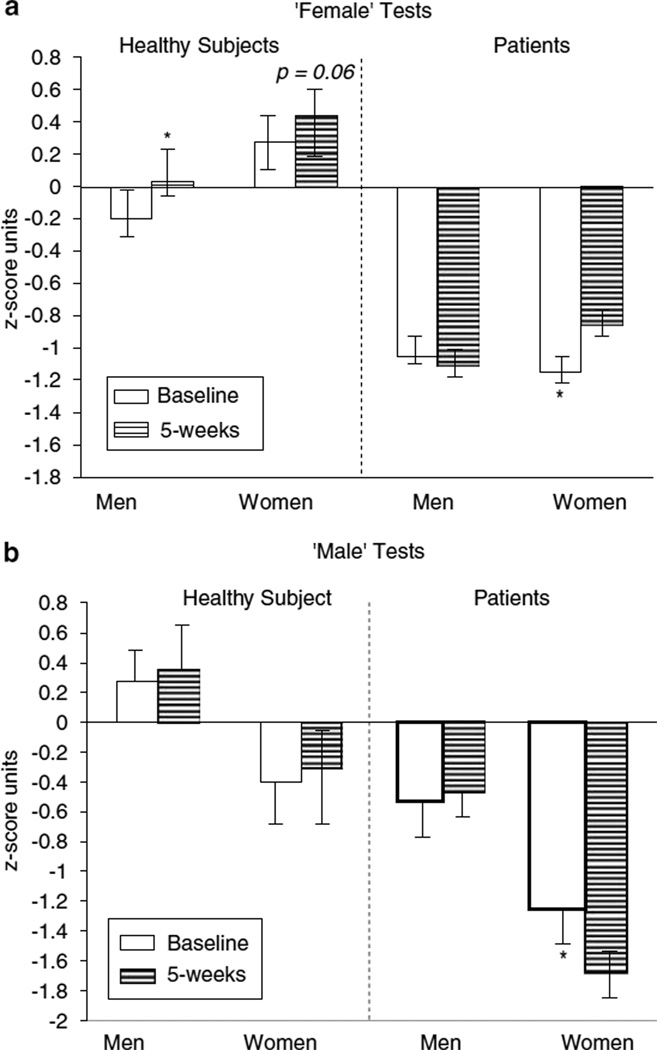
Figure 1.
Mean z-scores (+ SE) for healthy subjects and patients as a function of Time and Sex on (a) female’ tests and (b) ‘male’ tests. Note. The post hoc analysis showed a significant Group × Sex × Time × Test interaction, F(1, 105) = 4.75, p = 0.04. Asterisks denote significant pairwise difference in within-subject change over time. Female patients showed significant improvements on female’ tests and a decrease in ‘male’ tests over time. Male patients did not show significant improvement on ‘male’ or female’ tests. Composite scores were first created by computing within-test z-scores followed by between-test z-scores. Therefore, the composite scores will not sum to 0 as typically expected.

