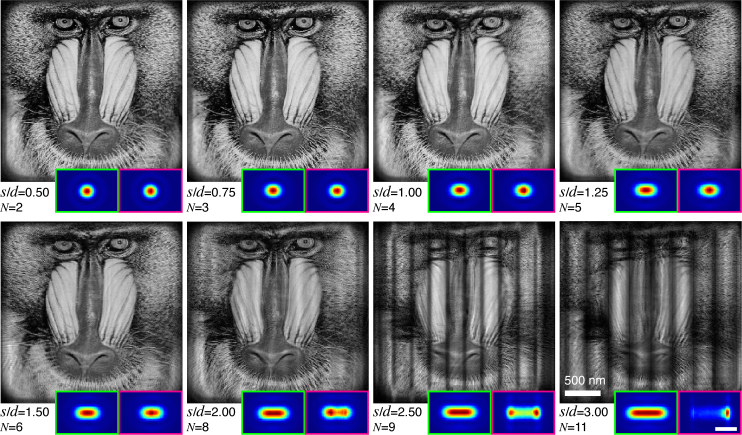
Fig. 3.
Reconstructions of simulated data with different values of the fly-scan pixel size s relative to an Airy beam FWHM of d = 100 nm, indicated by s/d. The probe mode number N shown here is the number above which the error of reconstruction (Eq. (8)) doesn’t decrease further. The inset at each panel shows the expected (green box) and recovered (magenta box) footprint (∝ s) of beam on the sample. The expected footprint was obtained through Eq. (5), while the recovered footprint is the sum of intensities of the reconstructed probe modes. Each reconstruction ran for 500 iterations. The scale bar for the footprints (lower right magenta box) is 200 nm.

