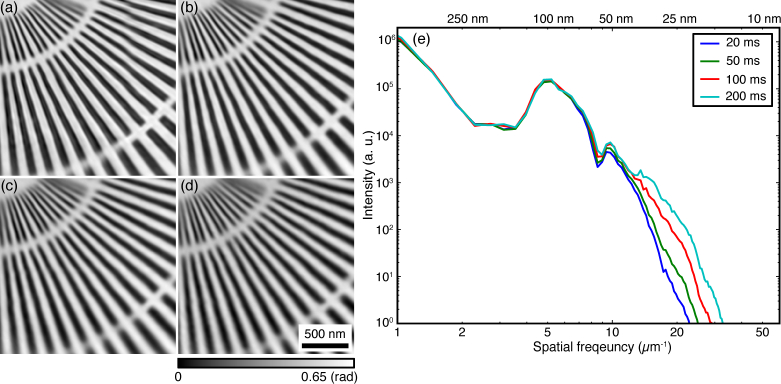
Fig. 10.

Fly-scan ptychography reconstructions (s/d =1.00 with d ≃ 100 nm) with different scan speed characterized by the per-fly-scan pixel collection time te = 200 msec (a), 100 msec (b), 50 msec (c), and 20 msec (d). (e) Azimuthally averaged power spectra of reconstructed images (a)–(d).
