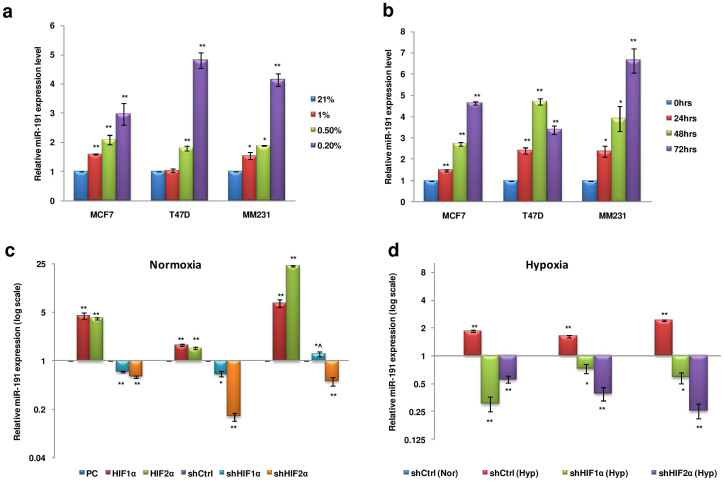
Figure 1. Transcriptional regulation of miR-191 in hypoxic microenvironment.
(a). Stem loop qRT-PCR data showing relative level of miR-191 in breast cancer cell lines (MCF7, T47D, & MM231) exposed to different pO2 (0.2%, 0.5%, 1% & 21%) for 48 hrs. (b). Stem loop qRT-PCR data showing time dependent induction of miR-191 levels in response to 0.2% hypoxia treatment in MCF7, T47D, & MM231 cells. (c, d). Effect of HIF overexpression (HIF-1α or HIF-2α) or inhibition (shHIF1α or shHIF2α) in normoxic (c) or hypoxic (d) conditions on the levels of miR-191 in a panel of breast cancer cell lines (MCF7, T47D, & MM231). The graphical data points represent mean ± S.D of at least three independent experiments. (*P < 0.05, **P < 0.01, *^P > 0.05 < 0.1). Error bars denote ± SD.

