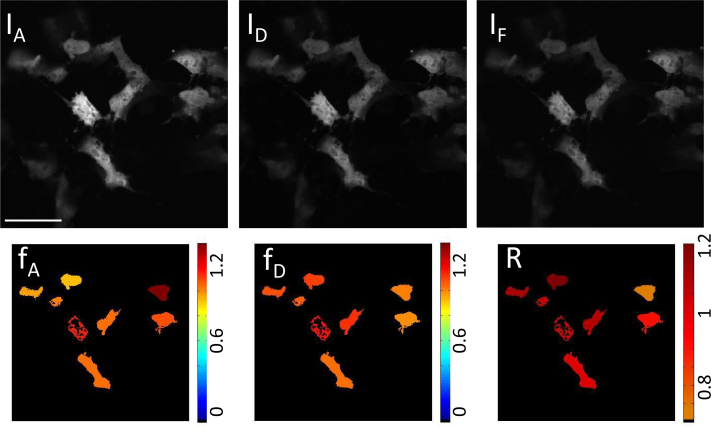
Fig. 4.
Top: Raw microscope images from channels IA, ID, and IF for cells expressing linked construct mAmetrine-tdTomato. Bottom: Color coded cells after analysis for the cells expressing linked construct mAmetrine-tdTomato giving the ratio of acceptor in construct (fA, expected value = 1), ratio of donor in construct (fD, expected value = 1), and absolute concentration ratio (R, expected value = 1). Scale bar insert:55 μm

