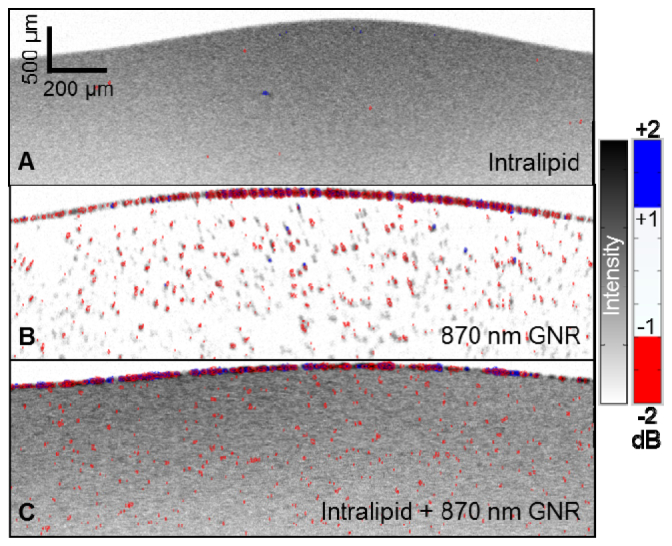
Fig. 4.

OCT images of (a) 0.1% intralipid, (b) dilute GNR with SPR at 870 nm, and (c) dilute GNR-in-intralipid. The OCT signal intensity is shown on an inverse gray scale, and the SLoW ratio is color-coded with cutoffs set at ± 3.09 SD ( ± 1 dB) of the spectral distribution of intralipid (Fig. 3(B2)). Intralipid (a) showed rare color pixels due to noise. The red GNR signal could be clearly visualized by itself (b) and when mixed with intralipid (c). The GNR aggregation layer at the test tube interface on top showed mostly red pixels with a few blue pixels.
