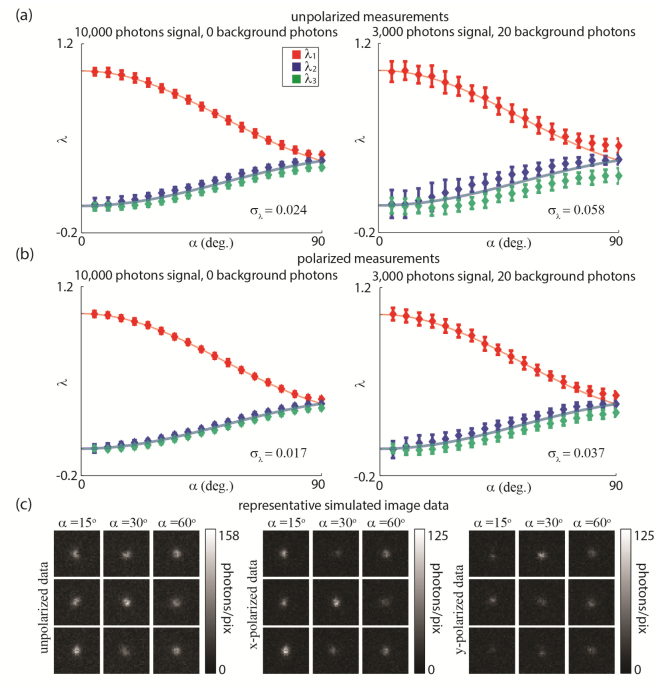
Fig. 8.
Results of numerical experiment 2. (a) and (b) Eigenvalue measurements from single-molecule images for unpolarized data (a) and polarized data (b). Overall standard deviations in eigenvalue measurements for each trial are noted on their respective plots. Error bars are . (c) Sample raw images of molecules with different α.

