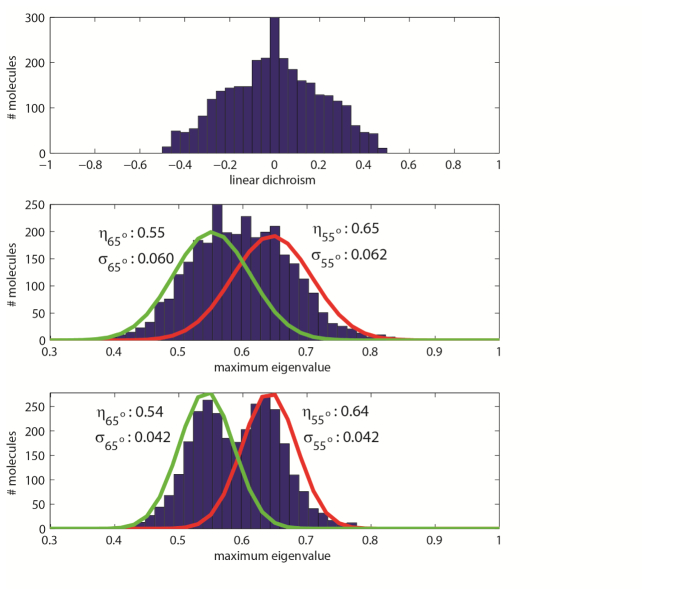
Fig. 9.
Results of numerical experiment 3. (a) Linear dichroism histogram. From this data alone, the presence of two distinct populations of molecules is not clearly evident. (b) Histogram of largest eigenvalues measured for each single-molecule image using unpolarized data. (c) Histogram of largest eigenvalues measured for each single-molecule image using polarized data.

