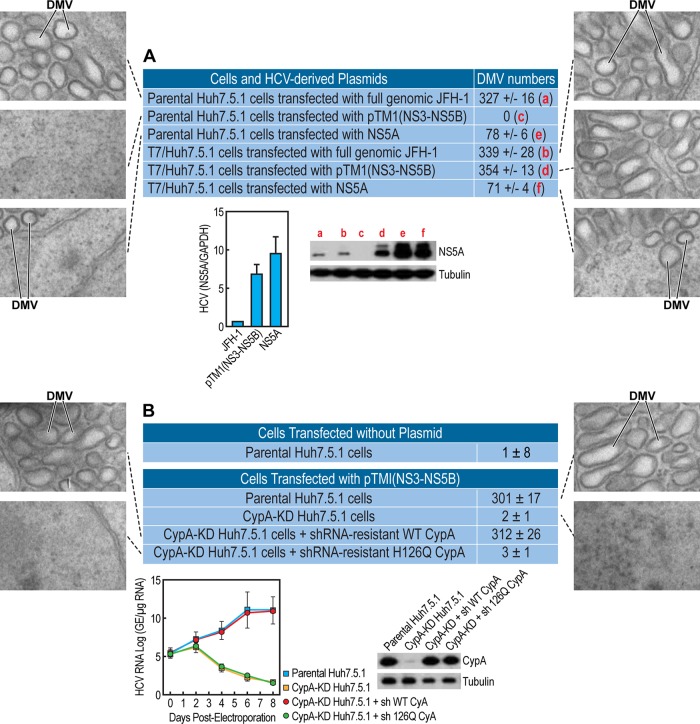
FIG 3.
Both NS5A and the isomerase activity of CypA govern DMV formation. (A) Parental or T7 polymerase-expressing Huh7.5.1 cells were transfected in triplicate with either full-genomic JFH-1 RNA, NS3-NS5B, or NS5A JFH-1 DNA plasmids and analyzed by EM as well as by ImageJ and the ITEM software for DMV quantification. Illustrated EM images of spherical or more tubular DMVs are presented. The two lower images display RNA and protein levels of NS5A in cells expressing JFH-1, NS3-NS5B, or NS5A. A quantitative RT-PCR using primers targeting the NS5A region was conducted, as we described previously (33). RNA levels of HCV and NS5A were normalized to GAPDH RNA levels. The mean normalized values from triplicate samples are plotted; the error bars indicate the standard deviation. Western blot analysis of CypA was conducted, as we described previously (33). (B) Parental Huh7.5.1 cells, CypA-KD cells, CypA-KD cells expressing shRNA for CypA-resistant wild-type CypA, or CypA-KD cells expressing shRNA for CypA-resistant isomerase-deficient H126Q CypA were cotransfected in triplicate with NS3-NS5B JFH-1 [pTM1(NS3-NS5B)] and T7 polymerase-expressing DNA plasmids and analyzed by EM as well as by ImageJ and the ITEM software for DMV quantification. Illustrated EM images are presented. The two lower images display a rescue analysis of CypA expression and HCV RNA replication in CypA-KD cells transfected with shRNA-resistant wild-type or isomerase-deficient H126Q CypA plasmids, as we described previously (33). The data are representative of two independent experiments.

