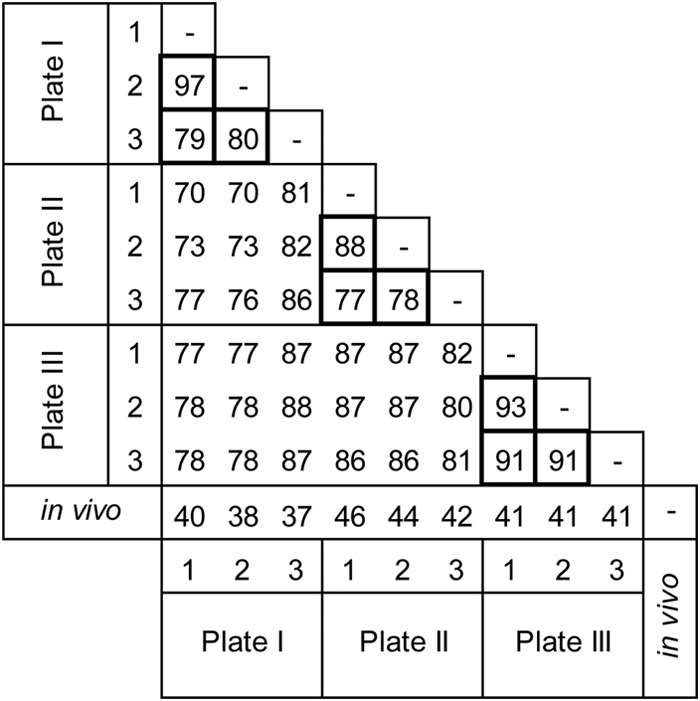
FIG 1.

Matrix of minimum similarity coefficient values for the microbial profiles for 9 in vitro biofilms from three 96-well plates (plate I, plate II, and plate III) and for these in vitro biofilms versus mean values for in vivo biofilms from 178 subjects. Cells with thicker borders include minimum similarity coefficient values for comparisons among biofilms from the same plate.
