
FIG 2.
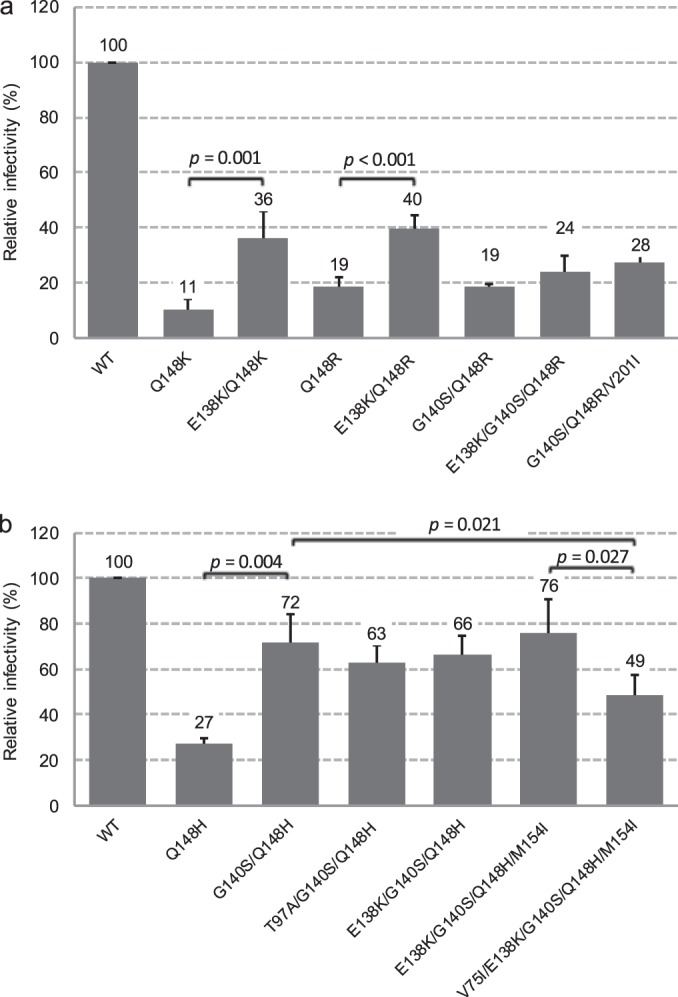
Relative infectivities in HeLa-CD4 assay of mutant viruses observed in this study. Each bar represents the mean from three to five independent experiments. The error bars represent standard deviations. Student's t test was used for statistical analysis, and the P values are shown.