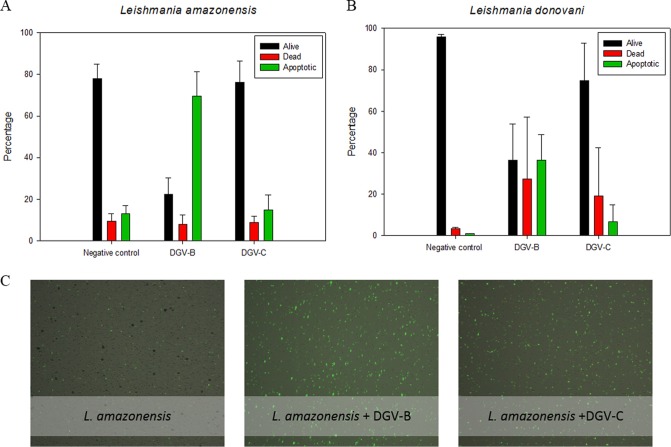
FIG 3.
Results of the phosphatidylserine exposure after 48 h of incubation with the IC90 of DGV-B and DGV-C. (A) L. amazonensis. (B) L. donovani. (C) Images were captured using a Tali image-based cytometer. Error bars represent the standard deviations (SD). Each data point indicates the mean of the results of three measurements.

