
FIG. 5.
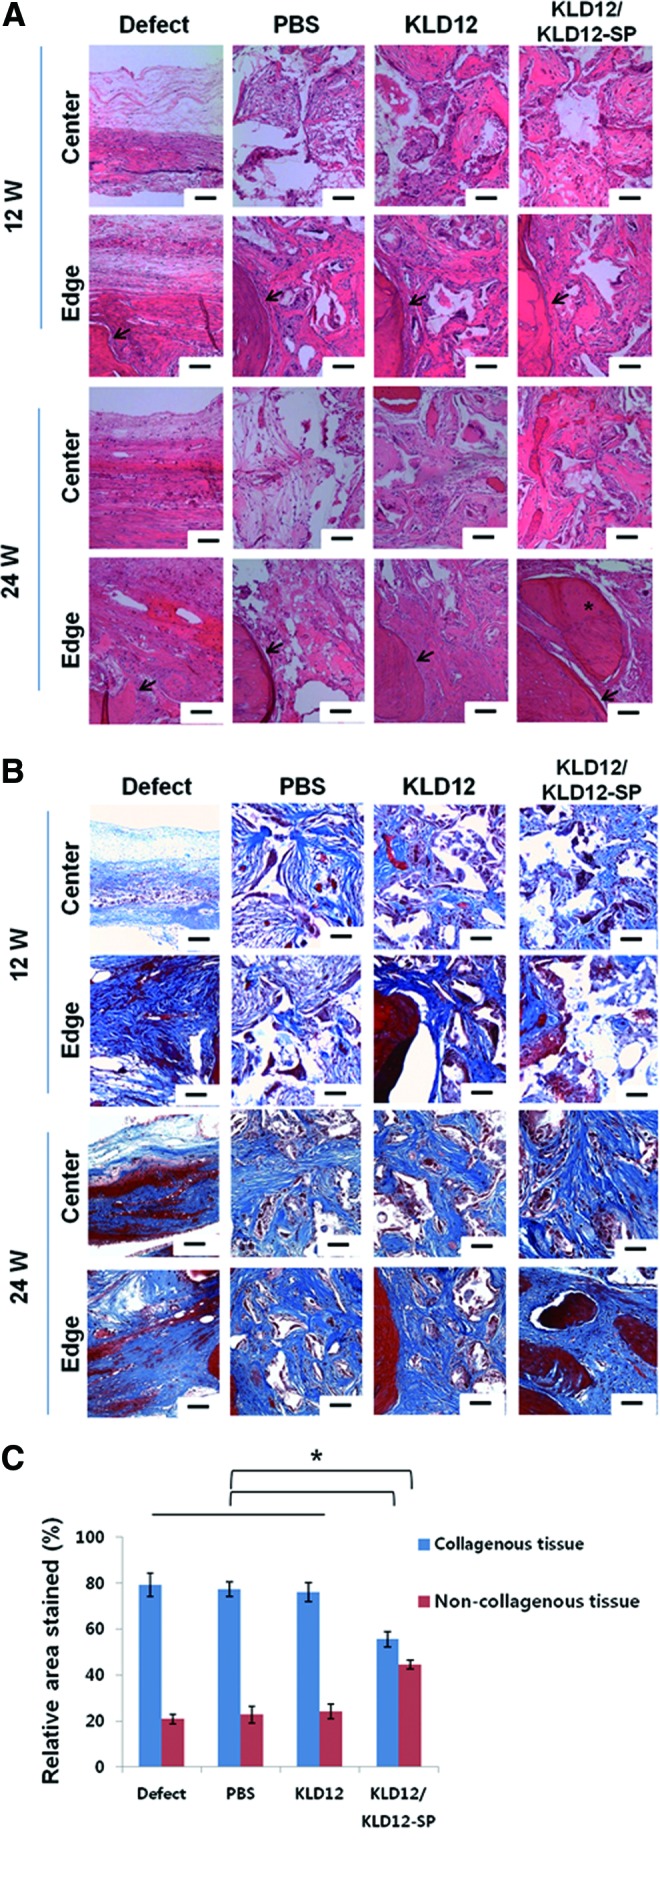
(A) Hematoxylin and eosin staining for each group (defect, PBS, KLD12, and bioactive KLD12) of the calvarial model at 12 and 24 weeks. The images of all groups were taken on the edge and center (arrow: interface between host tissue and new tissue, asterisk: new bone tissue [lacunae structure]). (B) Masson's trichrome staining for each group (defect, PBS, KLD12, and bioactive KLD12) of the calvarial model at 12 and 24 weeks. Photographs of the edge and center were taken for all groups. (C) Quantitative analysis of the stained area (collagenous and noncollagenous tissue) (*p<0.05). Scale bar: 50 μm. Color images available online at www.liebertpub.com/tea