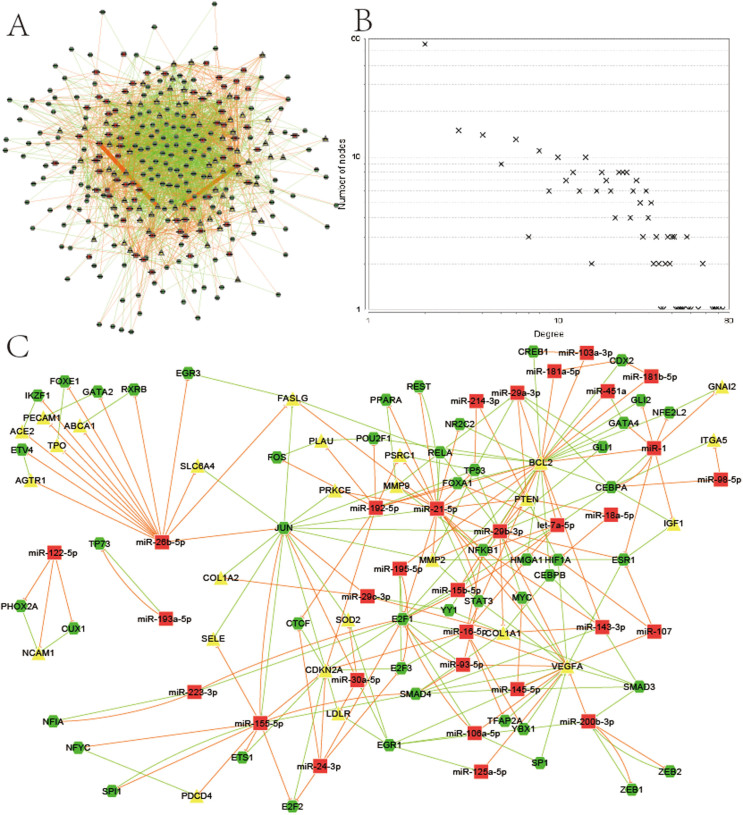
Figure 1. The MI miRNA-TF co-regulatory network and its characteristics.
(A) Graphical representation of the MI miRNA-TF co-regulatory network. (B) Node degree distribution in the network. (C) Verified FFLs in the MI network. Red rectangles: MI related miRNAs. Yellow triangles: MI related genes. Green hexagon: TFs. The edge colors represent different relationships: red for the repression of miRNAs to genes or TFs, green for the regulation of TFs to genes or miRNAs.

