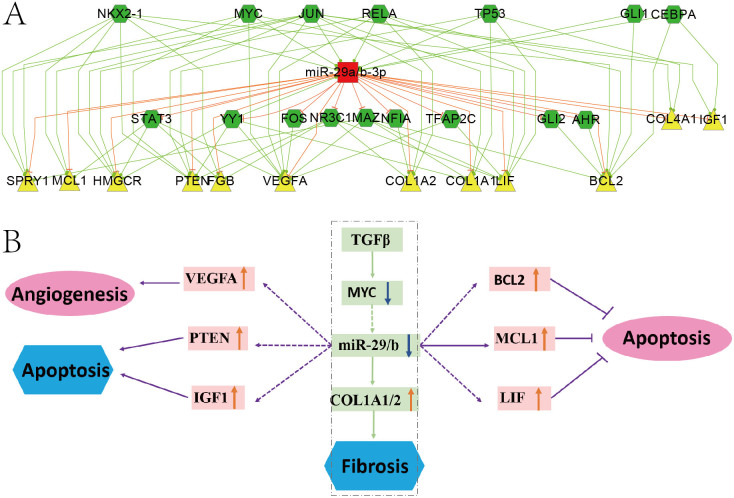
Figure 3. The miR-29a/b subnetwork and its model in MI.
(A) MiR-29a/b subnetwork. The means of different nodes and edges are the same as Figure 1. (B) Model of miR-29a/b involved in the incidence of MI. Rectangular represents regulators. Pink Oval and blue hexagon represents positive and negative effects, respectively. The orange up arrow and blue down arrow indicate the expression status of corresponding regulators. Solid and dashed arrows are the verified and predicted regulatory relationships, respectively.

