
Figure 1.
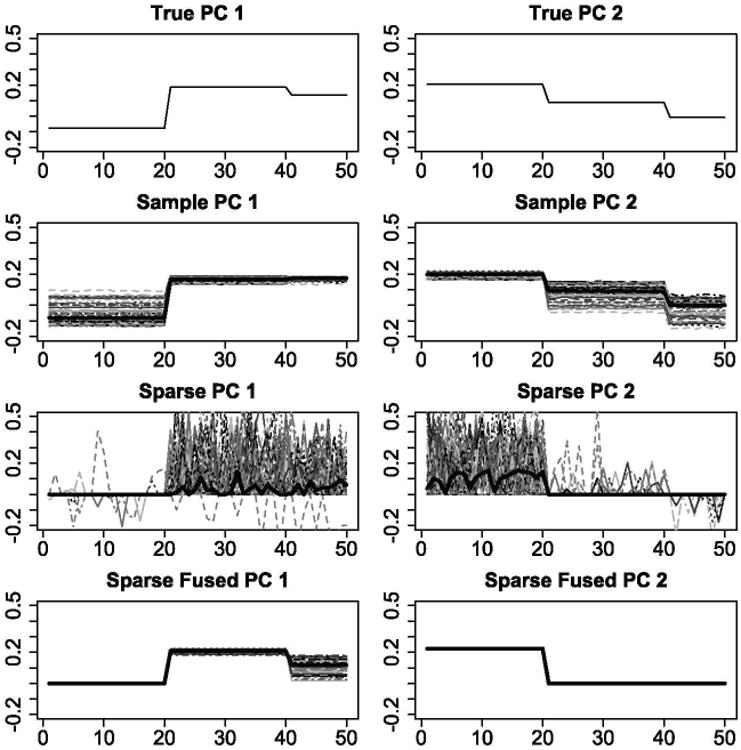
Factor loadings of the first (left column) and second (right column) PC vectors estimated by ordinary PCA from the true covariance (first row), ordinary PCA from the sample covariance (second row), sparse PCA (third row), and SFPCA (fourth row). The horizontal axis is the variables and the vertical axis is the value of the loadings. Each colored curve represents the PC vector in one replication. The median loadings over 50 repetitions are represented by the black bold lines. The online version of this figure is in color.