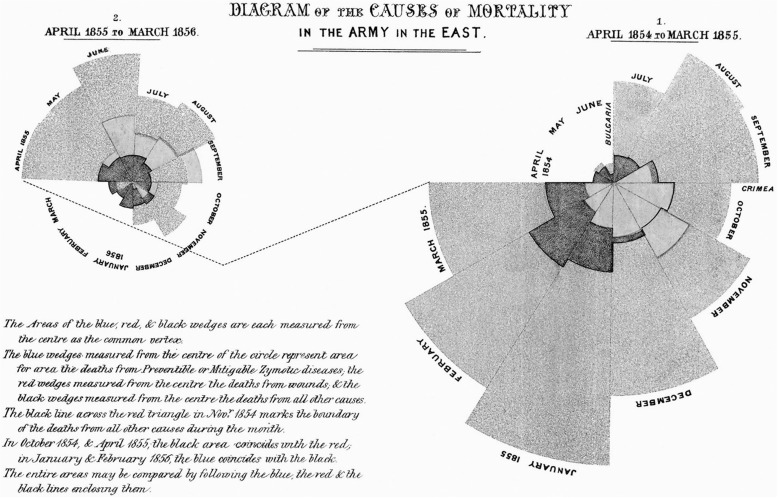
Figure 2:
Florence Nightingale's coxcomb chart representing causes of death each month between April 1854 and March 1856 during the Crimean War. The large outer gray bands represent deaths attributed to lack of sanitation in the wards, the lighter gray middle bands to death from wounds during the war, and the darkest inner bands to other causes. Public domain (U.S.) image via Wikimedia Commons. Available at http://commons.wikimedia.org/wiki/File:Nightingale-mortality.jpg. Accessed July 21, 2014.

