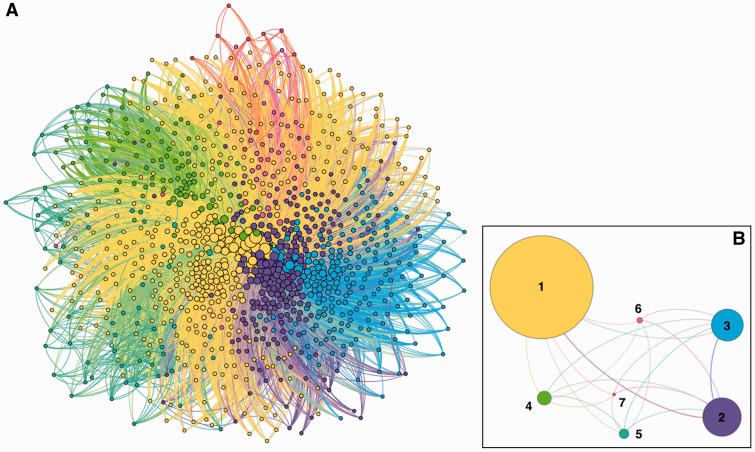
Figure 3::
Two representations of the patient-sharing network are shown. Node colors identify module membership. Edges are assigned the color of the source node. (A) Network view: nodes are providers and edges between providers indicate ≥ 10 shared patient record accesses. The edge weight was calculated using the shared patient index (see Materials and Methods section). (B) Modular view: nodes are groups of providers (modules) and edges between modules indicate patient record sharing between members of 2 modules and are weighted by total number of interactions between members. A total of 7 modules were identified.

