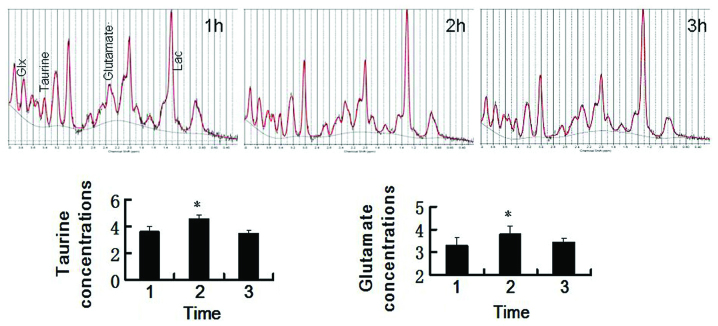
Figure 4.
1H-MRS of a rat with MCAO 1, 2 and 3 h after the onset of ischemia. Taurine and glutamate concentrations in the ischemic regions at different time-points following MCAO are shown. Error bars indicate the standard deviation (n=10/group). *P<0.05 vs. 1 and 3 h post ischemia. MCAO, middle cerebral artery occlusion; MRS, magnetic resonance spectroscopy.

