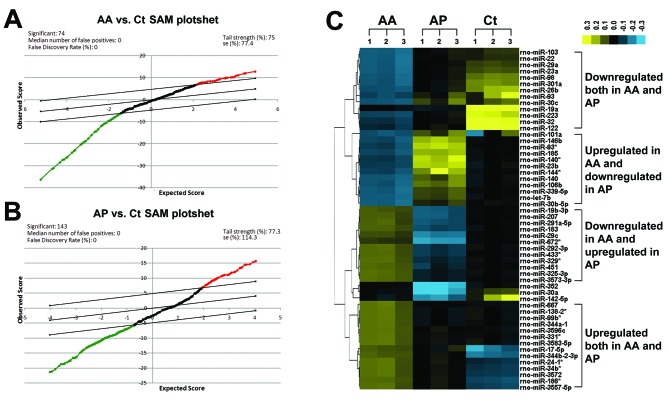
Figure 3.
(A and B) Significance Analysis of Microarray (SAM) plot and (C) heatmap of differentially expressed microRNAs (miRNAs). The δ-value in SAM analysis was set to 5, and the false discovery rate was 0. There are (A) 74 miRNAs differentially expressed in autoimmune-averse (AA) and (B) 143 miRNAs in autoimmune-prone (AP) rats. (C) In the heatmap, significantly upregulated miRNAs are shown in yellow, and downregulated miRNAs in blue. Twenty-four miRNAs are differentially expressed in the two different polyunsaturated fatty acid (PUFA) diet treatment groups. The colored scale bar represents the log2-converted fold-change value. Ct, control.

