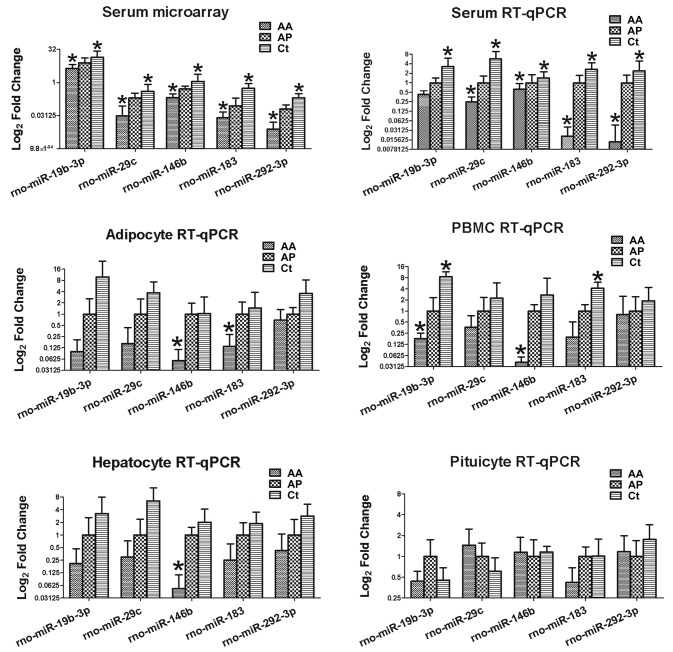
Figure 4.
Reverse transcription-quantitative polymerase chain reaction (RT-qPCR) validation of the identified microRNAs (miRNAs). Relative expression ratio of the miRNAs in the serum as assessed by microarrays (n=3), and RT-qPCR analysis in the serum, peripheral blood mononuclear cells (PBMCs), adipocyte, hepatocyte, and pituicyte. The relative amounts of each miRNA were normalized to that of the U6 small nuclear RNA). The y-axis values were transformed to log2 scales, and all data are shown as means ± standard error of the mean. *P<0.05 compared to the control. AA, autoimmune-averse; AP, autoimmune-prone; Ct, control.

