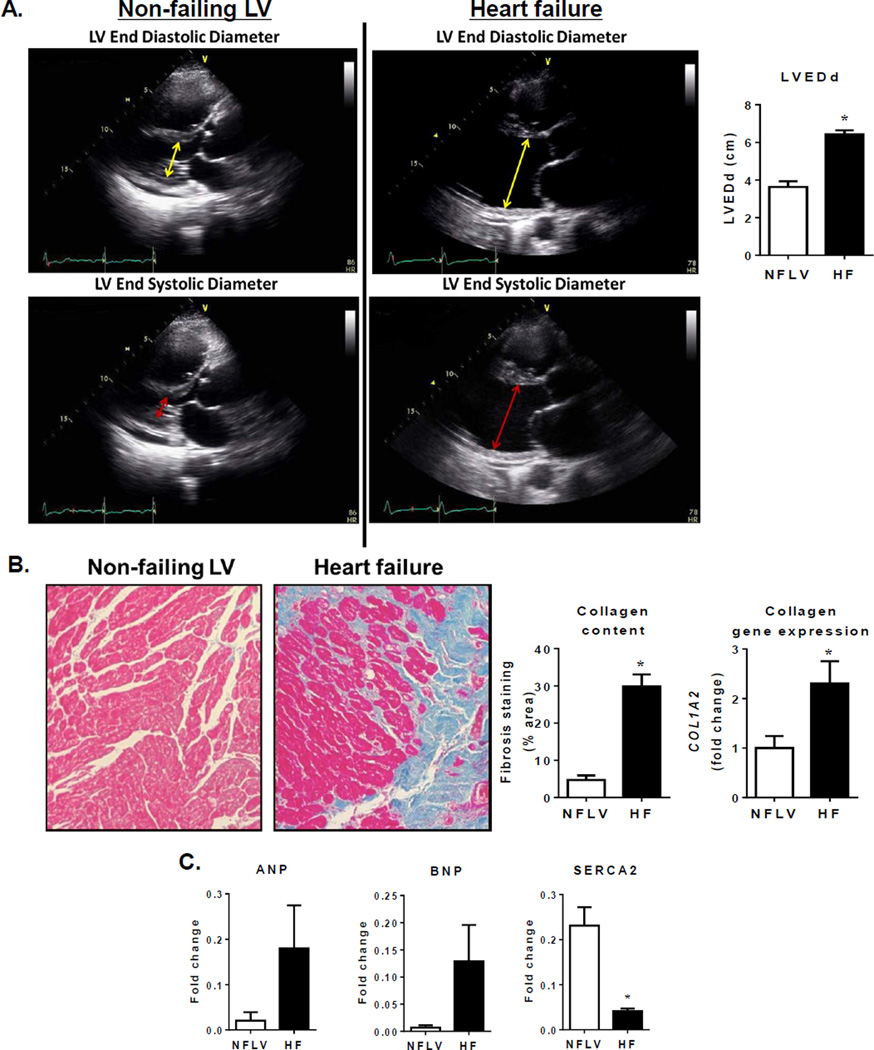
Figure 1.
NFLV tissue serves as a unique comparator for failing LV. Panel A: Representative echocardiography images of NFLV and failing LV for size and function comparison. Non-failing LV: Upper figure illustrates normal LV size (yellow double headed arrow defines the left ventricular end diastolic diameter (LVEDd) 3cm). Lower figure illustrates normal LV systolic function (double headed red arrow defines the left ventricular end systolic diameter (LVESd) 1.8 cm, equates to a fractional shortening of 40% and a LV ejection fraction (EF, ~ 68%). Failing LV: Upper figure illustrates a severely dilated LV (yellow double headed arrow notes a LVEDd ~ 7 cm). Lower figure illustrates severely depressed LV systolic function (double headed red arrow LVESd ~ 6.3 cm equates to a fractional shortening of 10% and a LVEF ~17%). Quantitation of LV end diastolic dimension (LVEDd) indicating normal size of NFLVs and LV hypertrophy in HF (Mean±SEM; *P<0.001 versus NFLV by Mann Whitney test, NFLV: N=6, HF: N=6). Panel B: images for Masson’s trichrome staining, quantitation for collagen content and gene expression of collagen 1α2 (COL1A2) indicative of absence of fibrosis in NFLV but increased fibrosis in LV of HF patients (Mean±SEM; *P<0.001 versus NFLV by Mann Whitney test, NFLV: N=6, HF: N=6). Panel C: changes in expression of characteristic heart failure genes ANP, BNP and SERCA (Mean±SEM; *P<0.01 versus NFLV by Mann Whitney test; NFLV: N=6, HF: N=6).

