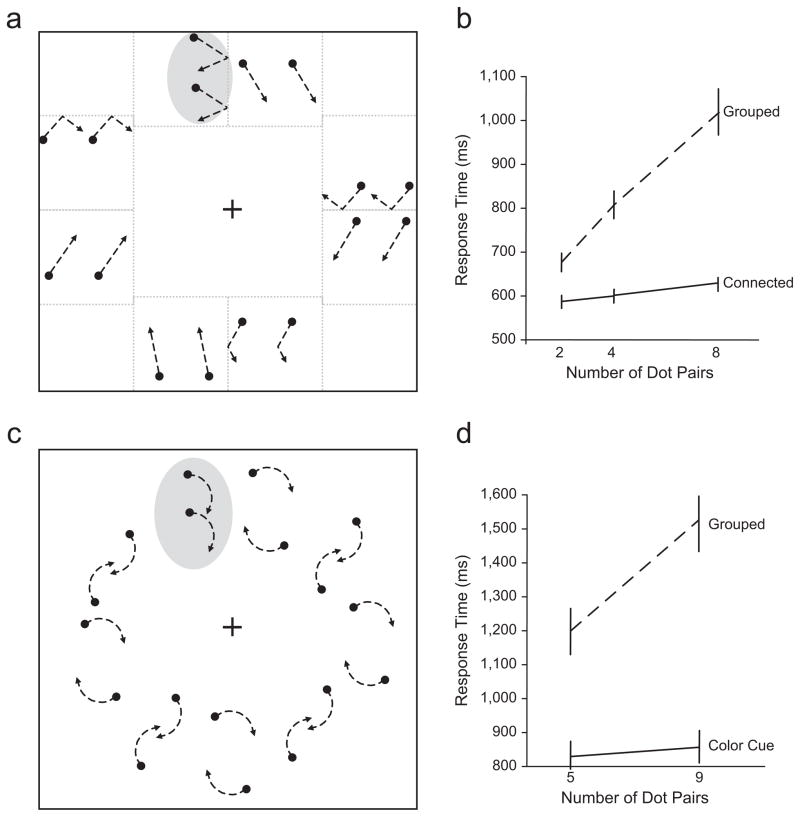
Fig. 2.
Experimental stimuli and results. In Experiment 1, each display contained two, four, or eight dots pairs defined by common movement (a), and participants searched for a vertically oriented pair (highlighted here by the gray shading) among horizontally oriented pairs; the graph (b) shows response time in the two conditions as a function of the number of dot pairs in the display. In Experiment 2, each display contained five or nine dot pairs; the dots in distractor dot pairs moved 180° out of phase, and the dots in target pairs moved in phase (c). Participants indicated whether a target dot pair was absent or present on each trial. The graph (d) shows response time in the two conditions as a function of the number of dot pairs in the display. Error bars indicate standard errors of the mean.

