
Figure 4.
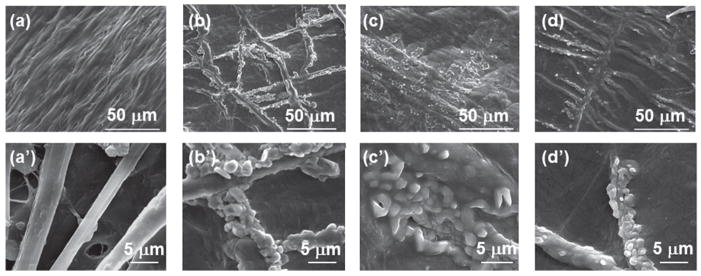
SEM images of SIS membranes after different mineralization times (0, 12, 24 and 96 h). (a)–(d) are typical images of the SIS membranes that were mineralized for 0, 12, 24 and 96 h, respectively. (a′)–(d′) are typical high magnification images taken from some areas on the the same membranes shown in (a)–(d), respectively.