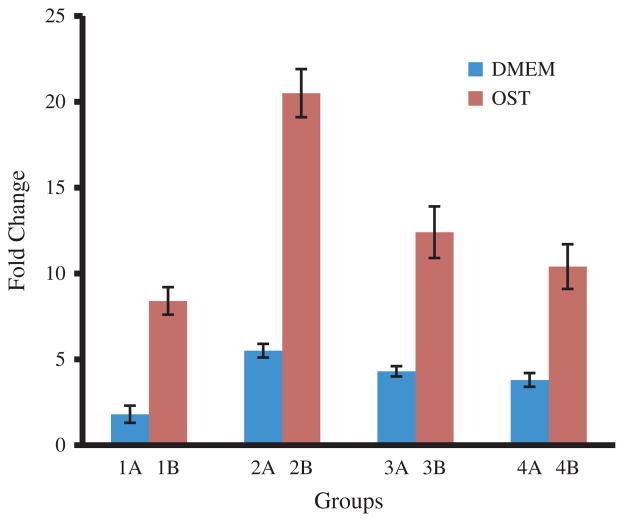
Figure 8.
Real-time PCR analysis showing the level of osteocalcin gene expression of cells cultured on different substrates in DMEM (Group A) and OST (Group B) media for 15 days. Group 1: non-mineralized SIS membranes; Group 2: SIS membranes mineralized for 12 h; Group 3: SIS membranes mineralized for 24 h; Group 4: SIS membranes mineralized for 96 h.

