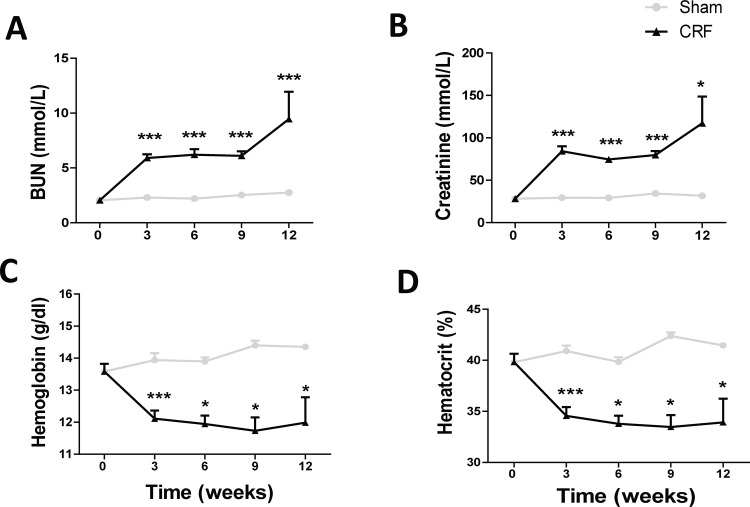
Fig 1. Renal and hematological data throughout the follow-up period of 12 weeks.
Evolution of BUN (A), creatinine (B), hemoglobin (C) and hematocrit (D) values throughout the experimental protocol. Results are presented as mean ± SEM: *- p < 0.05, **- p < 0.01, and ***- p < 0.001 versus Sham group. BUN, blood urea nitrogen.

