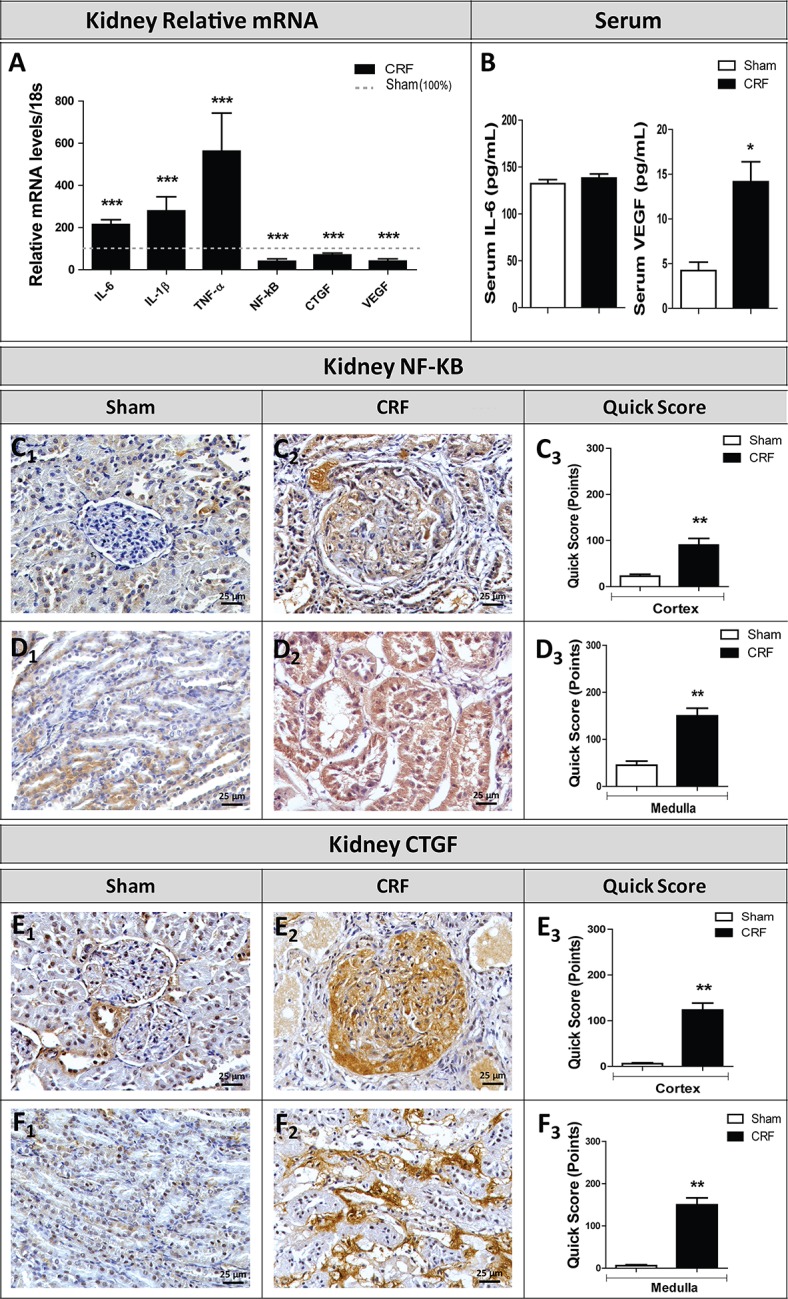
Fig 7. Relative gene expression mRNA levels/18s (% of Sham group) of markers of kidney lesions (A).

Serum IL-6 and VEGF-α levels (B). Immunohistochemical expression of NF-kB and CTGF in renal cortex (C1-C3 and E1-E3, respectively) and medulla (D1-D3 and F1-F3, respectively) (original magnification, x400). Results are presented as mean ± SEM: *- p < 0.05 and **- p < 0.01 versus Sham group. CTGF, connective tissue growth factor; IL-1β, interleukin- 1 beta; IL-6, interleukin-6; NF-kB; nuclear transcription factor kappa B; TNF-α, tumor necrosis factor alpha; VEGF, vascular endothelial growth factor.
