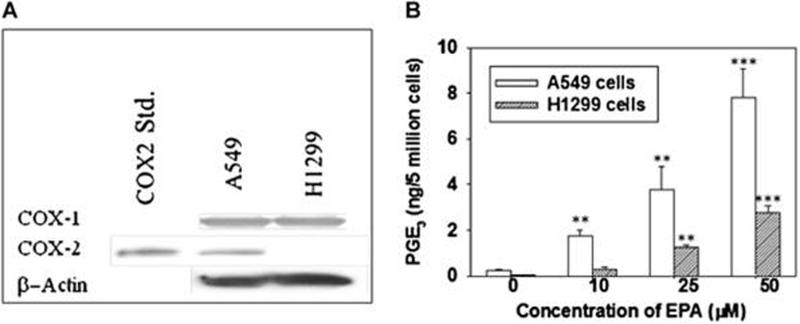
Figure 2.
The expression of COX-1 and COX-2 in A549 and H1299 cells and the relatively formation of PGE2 and PGE3 is shown for both cell line. A. A549 and H1299 cells were collected, lysed, and protein levels of COX-1 and COX-2 determined by Western blotting with relevant antibodies. B. Cells (5 × 10⁶) were treated with EPA (25 to 100 μM) for 20 min at 37°C followed by extraction with hexane and ethyl acetate (1:1) as described in Material and Methods. The formation of PGE3 by EPA in A549 cells was markedly higher than that in H1299 cells. * P < 0.05, ** P < 0.01, and *** P < 0.005 versus control vehicle treated. Data are presented as the means ± SDs of three independent experiments.

