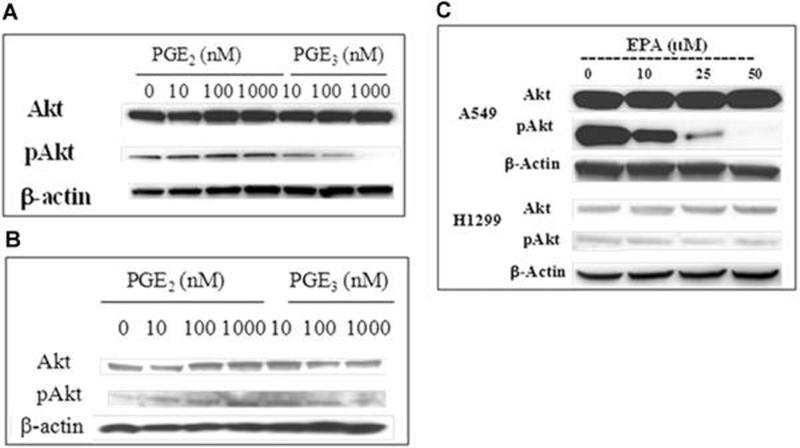
Figure 4.
The effect of PGE2, PGE3, and EPA on expression of Akt and pAkt in H1299 and A549 cells. Cells (2 × 10⁶) were plated and allowed to attach overnight. They were then serum starved for 24 hrs followed by treatment with PGE2, PGE3 (10 to 1000 nM) or EPA (10 to 50 uM) for an additional 24 hrs. Cells were then harvested, proteins extracted and subjected to measurement of Akt and pAkt proteins by immunoblotting. A. A549 cells treated with PGE2 and PGE3; B; H1299 cells cells treated with PGE2 and PGE3; C A549 and H1299 treated with EPA. The data are representative of two sets of experiments with similar results.

