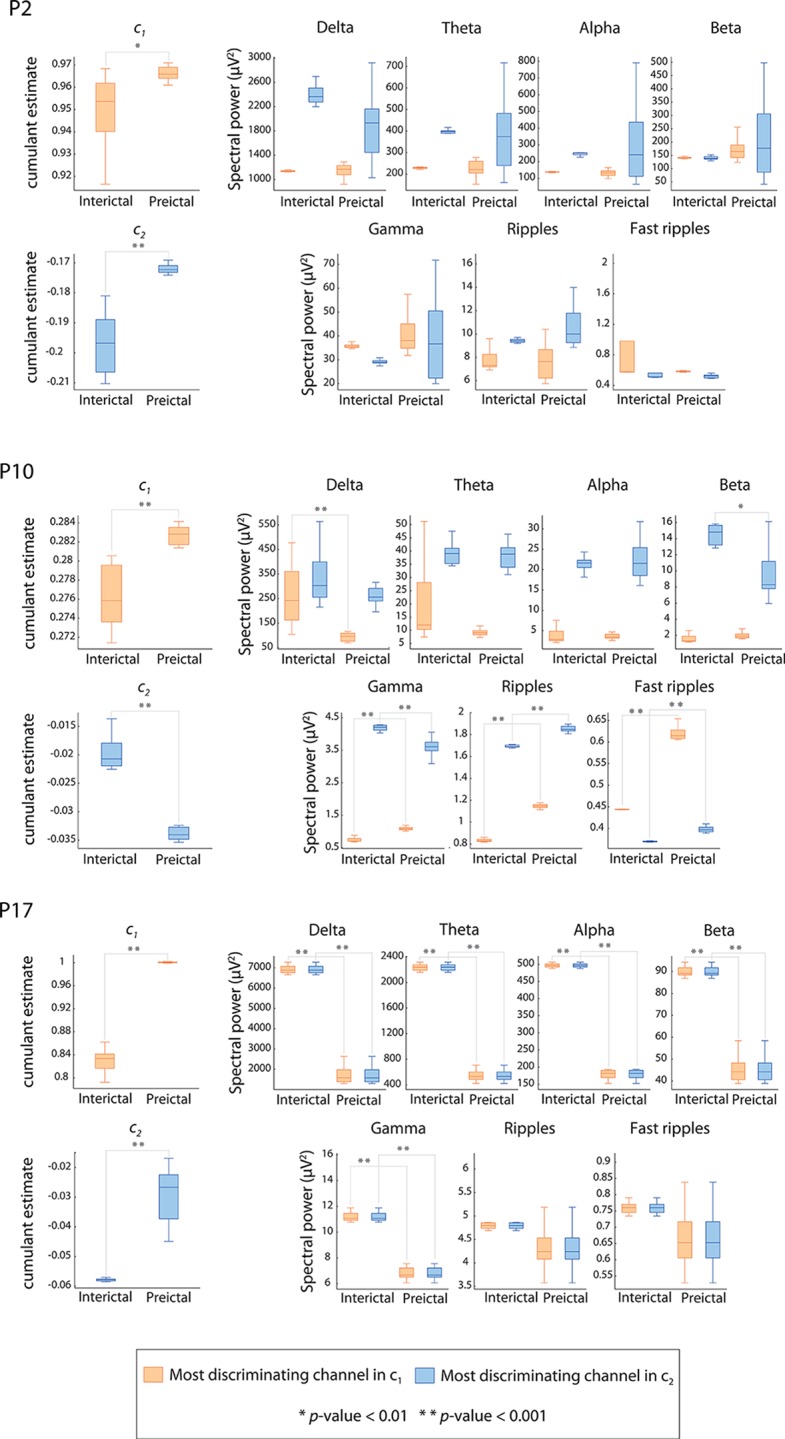
Fig 4. Cumulant vs. spectral power.

Box-and-whisker plot (minimum-maximum range) indicating differences in three patients (P2, P10 and P17) between preictal and interictal average 5-min observations of cumulant c 1, cumulant c 2 and the spectral power in the conventional EEG bands. Boxes in orange represent observations from the most discriminating channel in cumulant c 1. Boxes in blue represent observations from the most discriminating channel in cumulant c 2. Significant differences between preictal and interictal observations are denoted by asterisks (* p-value < 0.01, ** p-value < 0.001).
