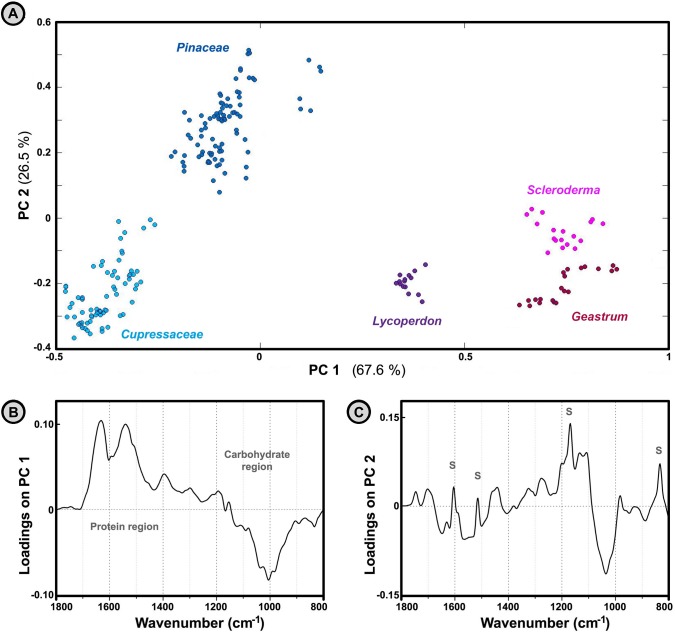
Fig 6. Analysis of spectra belonging to fresh spores and Pinales pollen.
PCA plot of IR spectral data set of fresh spores and Pinales pollen (three spectra per sample; MSC corrected spectra), with depiction of plant families and fungal genera. The percent variances for the first five PCs are 67.57, 26.50, 1.77, 1.26 and 0.65. (B) Loadings plot on the first two principal component of the PCA; the marked signals (S) are associated with vibrational bands of sporopollenins.

