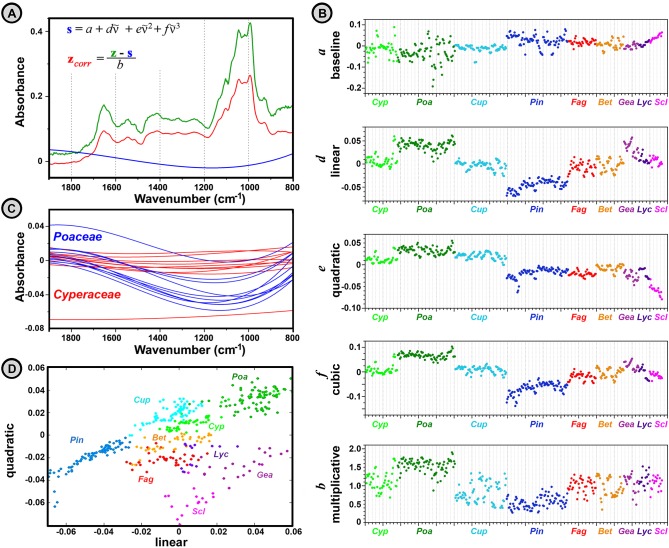
Fig 11. Separation of physical and chemical information in spectra of pollen and spores.
(A) FTIR spectra of Poa pratensis: recorded spectrum (green), scatter estimate with constant, linear, quadratic, and cubic terms (blue), and EMSC corrected spectrum (red) (multiplicative parameter b for Poa pratensis is 1.65); Savitzky–Golay smoothing (quadratic polynomial with window size 11) was obtained prior to EMSC correction with weighting vector. (B) EMSC parameters, and (C) scatter estimates for 10 Poaceae (blue) and 10 Cyperaceae spectra (red). (D) plot for linear and quadratic EMSC parameters for measured samples: Cyperaceae (Cyp), Poaceae (Poa), Cupressaceae (Cup), Pinaceae (Pin), Fagaceae (Fag), Betulaceae (Bet), Geastrum (Gea), Lycoperdon (Lyc), and Scleroderma (Scl).

