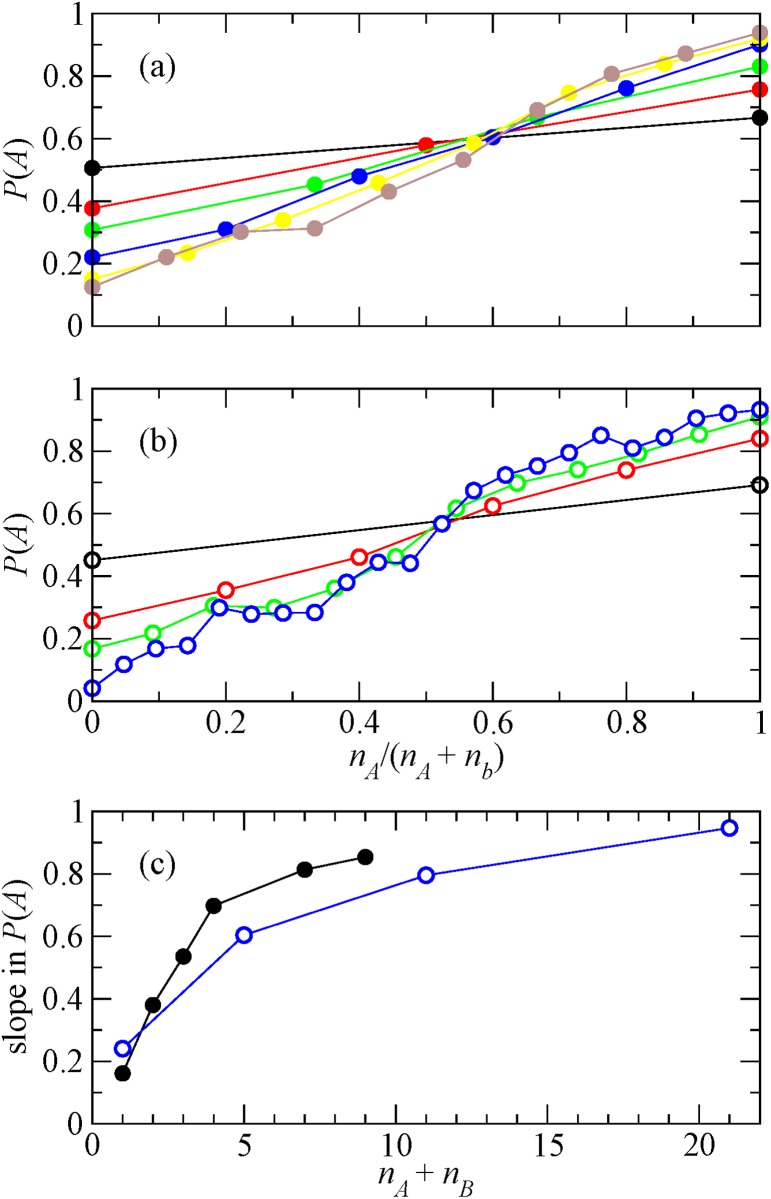
Fig 3. Dependence on the fraction of correct answers.
(a) Probability to answer correctly as a function of the fraction of correct answers of the previous respondents for data set D 1. Black r = 1, red r = 2, green r = 3, blue r = 4, yellow r = 7, and brown r = 9. (b) Same results for data set D 2. Black r = 1, red r = 5, green r = 11, and blue r = 21. (c) Slope as a function of r obtained by the least square method applied to the plots in panels (a) and (b). The closed and open circles correspond to D 1 and D 2, respectively.

