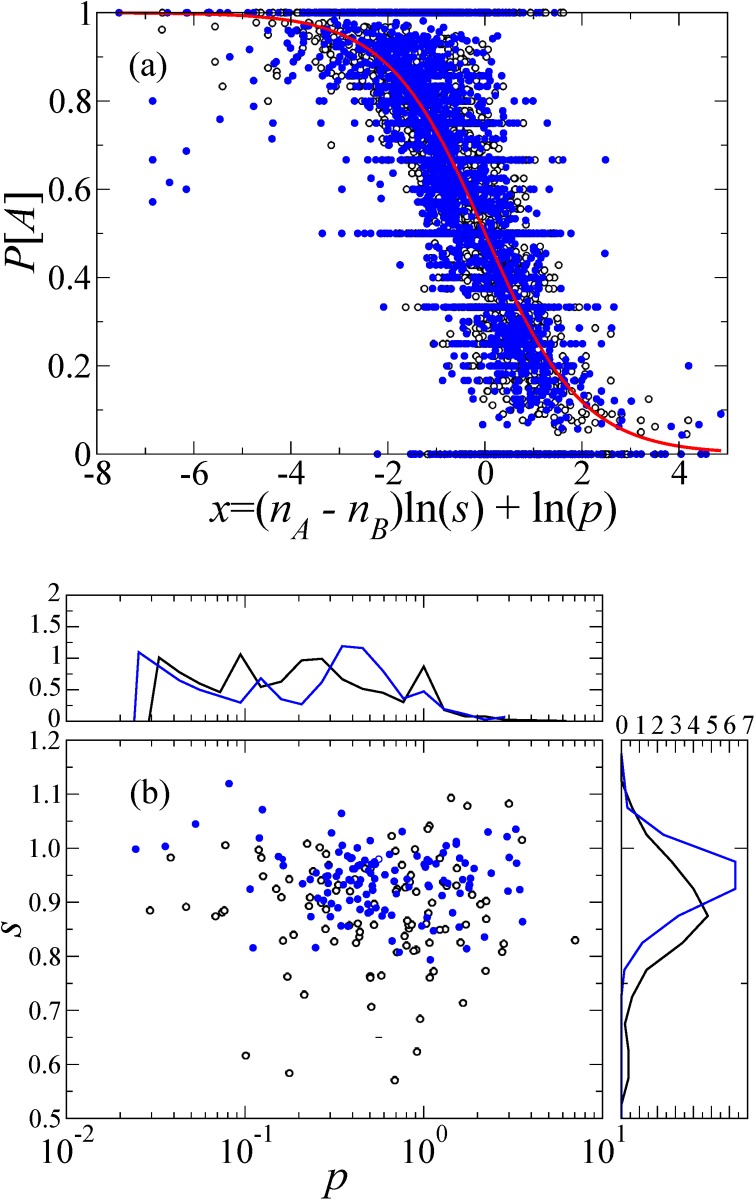
Fig 4. Dependence on the question.
(a) Probability of correct answers as function of rescaled accumulated answers of previous respondents (n A − n B) ln (s) + ln (p). Each symbol represents a question. Black, open symbols correspond to D 1, and blue filled circles to D 2. We estimated the s and p values for each question by applying the least square method to the data for the corresponding question. (b) Estimated p and s values for different questions. The top and side panels show the distributions of p and s, respectively.

